
 IVN Editorial Board
The independent voter has finally been noticed.
In the Los Angeles Times this week, Justine McDaniel reports that independents are now the “kingmakers” of the 2026 midterms. Gallup puts the number at a record 45% of American adults, against 27% for each party. Nearly every competitive Senate race runs through states with large unaffiliated populations. As Jeremy Gruber of Open Primaries puts it, “Independent voters are going to be deciding this election in every respect.” The piece even uses the Independent Voter Project’s own state-by-state data to show how large that bloc has become.
 Cara Brown McCormick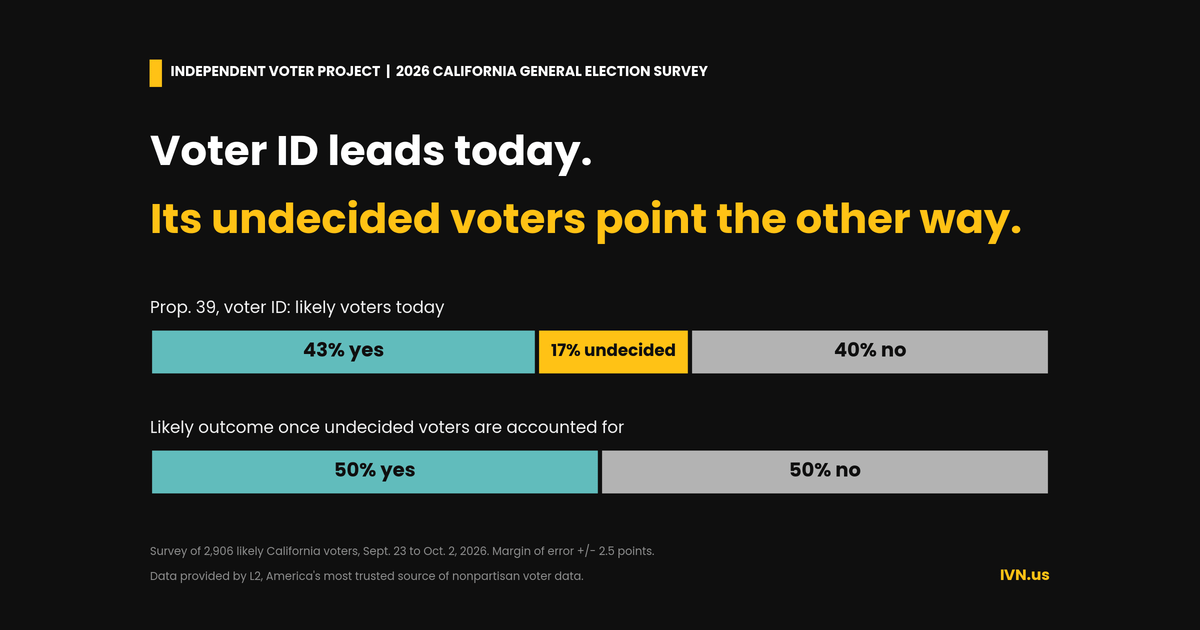
The problem? Watch how campaigns relate to these voters. They “fight for” them. They target the independents who lean their way. Karen Kedrowski, a political scientist at Iowa State, advises Democrats to make it “seem safe” for an independent to vote their way. Her advice isn't to be a candidate a voter can trust; it is to simply appear that way, whether the candidate is or isn't.
Republicans answer with ad blitzes built to define their opponents, and just yell the same thing they’ve been saying even louder.
In California alone, 5.2 million voters are registered with no party preference, about 22% of the electorate, according to VoterCount.ai. Add the roughly 950,000 voters on the American Independent rolls and more than six million Californians have no home in either major party. That is more voters than the state's entire registered Republican base. These are the people the LA Times is calling kingmakers.
They’re right. But the political class has it all wrong about independent voters.
In The Conversation, political scientist Robert Boatright shows what happens upstream, in the primaries that settle most seats long before November. National turnout in primaries has averaged about 20% of the voting-age population in recent midterms. In primary elections, the people who show up are older, wealthier, and less diverse than the country they nominate candidates for. They are also inconsistent. Looking at more than three million voters, Boatright and his co-authors found that fewer than half of the people who voted in a given primary had voted in the one four years earlier. A small and shifting slice of the electorate is choosing most of Congress, and the nonaligned voter is mostly not in it.
In Capitol Weekly, Paul Mitchell shows the end of that same story. Studying California’s same-party runoffs, he estimates that the undervote, the people who skip a race entirely, can be the single largest bloc on the ballot, larger than the margin between the two candidates. He runs the precinct math to estimate who leaves which race blank.
California is where this plays out most clearly. Because the Top Two primary sends the two leading finishers to November regardless of party, voters across the state now face runoffs between two candidates from the same party.
In the race for Insurance Commissioner, Jane Kim faces Ben Allen, both Democrats. In the 7th Congressional District, Mai Vang faces Representative Doris Matsui, both Democrats, in a June primary decided by about 3,500 votes. In Senate District 24, John Erickson faces Brian Goldsmith, both Democrats.
In each district, No Party Preference voters make up close to a quarter of the electorate, roughly 98,000 in the 7th CD and more than 150,000 in SD 24, according to VoterCount.ai. They are large enough to decide the outcome and the voters most likely to leave the race blank.
In the 22nd Congressional District, for example, only 16.7% of unaffiliated voters cast a ballot in the 2022 midterm.
 IVN Editorial Board
Everyone has learned to measure the independent voter. The LA Times counts them. Boatright profiles them. Mitchell tries to model exactly which race they will skip. None of that measurement talks to them.
A voter described from the outside, as a bloc to be won or a variable in a regression, is still a voter no one has actually spoken to.
The November ballot shows what changes when someone explains the choice plainly. The Independent Voter Project’s statewide poll of 2,906 likely California voters found three measures where the result turns less on party than on what voters are told.
Proposition 39, the voter identification measure, leads 43% Yes to 40% No, with 17% undecided. That undecided group is the whole contest. It is 61% Democrats and 24% independents, and more than half of them trust neither party enough to take a cue from it.
Overall, 40% of independents trust neither party. The measure’s official title, written by the attorney general’s office, reads “Prohibits Citizens from Voting Unless They Present Government-Issued Identification.” Described in plainer terms, as a government ID requirement with a free card available, support rises to 62%.
The wording is doing more work than the party label.
Proposition 40, the tax on billionaires to fund health care, shows the same sensitivity. It leads 40% to 38% when described in plain terms and trails 38% to 42% once voters hear the Legislative Analyst’s cost estimate. Proposition 41, which would require audits of new special taxes, leads comfortably, but only when voters know what it’s about. A voter who doesn't know that can cancel out their own intent.
None of this means voters are incapable. It means the ballot is genuinely hard to read, and the campaigns have little incentive to make it easier for anyone outside their base.
The growth of the undervote is not a mystery that needs a model to solve. In a same-party race, a voter who doesn't belong to either party is handed two candidates from a club they never joined, with very little information to tell them apart.
Campaigns spend where the model says the votes already are. They turn out their base and treat everyone else as either locked up or a lost cause. Often, that isn't even a decision to ignore the independent voter. It is that campaigns don't know how to speak to them.
That gap is the reason the Independent Voter Project exists. When voters get real information about how their vote actually works, what a Top Two runoff is, and what a down-ballot race decides, they use it.
Before the June 2026 primary, IVP reached roughly 2.8 million independent voters. Turnout among No Party Preference and American Independent voters rose 52% over the last comparable midterm primary, from about 1.17 million ballots to 1.78 million, almost twice the rate of either major party.
We cannot, and do not, claim the program was the sole cause of the unexpected nonpartisan turnout. But where we've run these programs, even on limited budgets, the results have been consistent: higher participation.
The problem has never been that independent-minded voters are apathetic. It’s that they’ve tuned out partisan politics.
Instead of trying to “seem safe,” candidates and campaigns should treat independent voters like people, not data points in a regression analysis. Yet, consultants and data vendors who make their living describing and targeting the electorate drive blindly partisan campaigns from opposite directions.
As long as this is true, one side wins. And the prophecies of partisan politics continue.
But for now, IVP will keep doing what it can with the resources it has. We will give voters enough information to use their vote meaningfully in races where independent-minded voters can make the biggest difference.
The goal is simple and measurable. Broader participation and, over time, representation that looks more like the communities we actually live in, rather than the narrow and predictable slice the current system rewards.
Disclosure: IVN.us is co-published by the Independent Voter Project.