 Cara Brown McCormick
SAN FRANCISCO – Most polls answer one question: if the election were held today, who would win? We asked a slightly different question: who are the undecided voters, and how will they vote?
Surveys like the one sponsored by the Public Policy Institute of California are built to measure where a race stands at a particular point in time. They do that job well, in part by asking nearly every respondent to pick a side. The Independent Voter Project survey is built to study the voters who have not picked a side, or who can still be persuaded. It reports them separately, then looks at who they are.
That matters because undecided voters are not a random slice of the electorate. Who is still undecided varies by each race and ballot question, and the makeup of that group best guides where a close contest is likely to land.
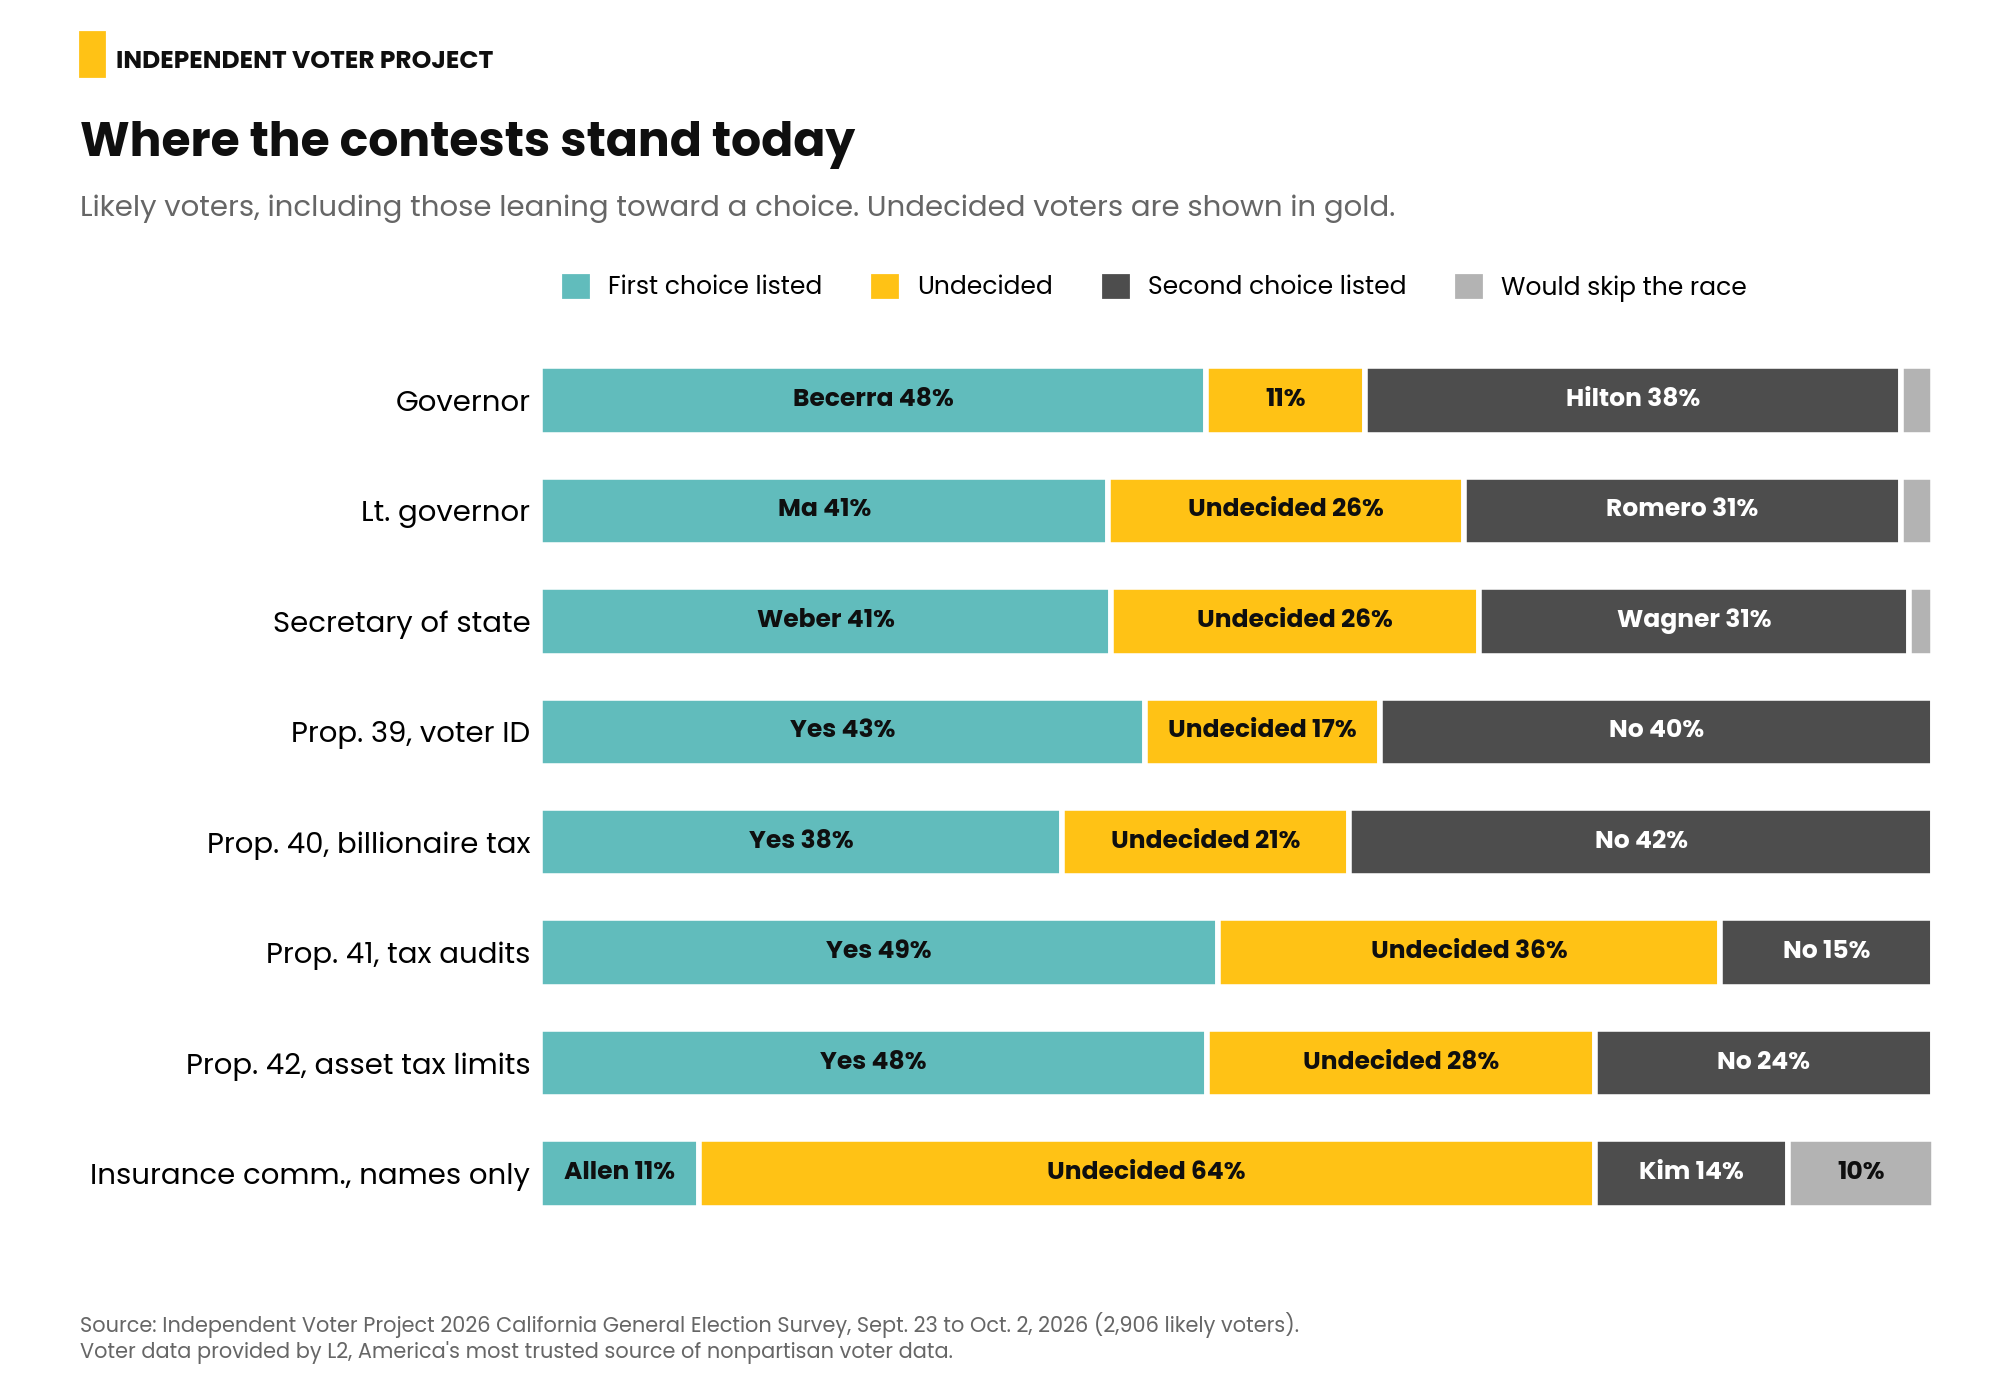
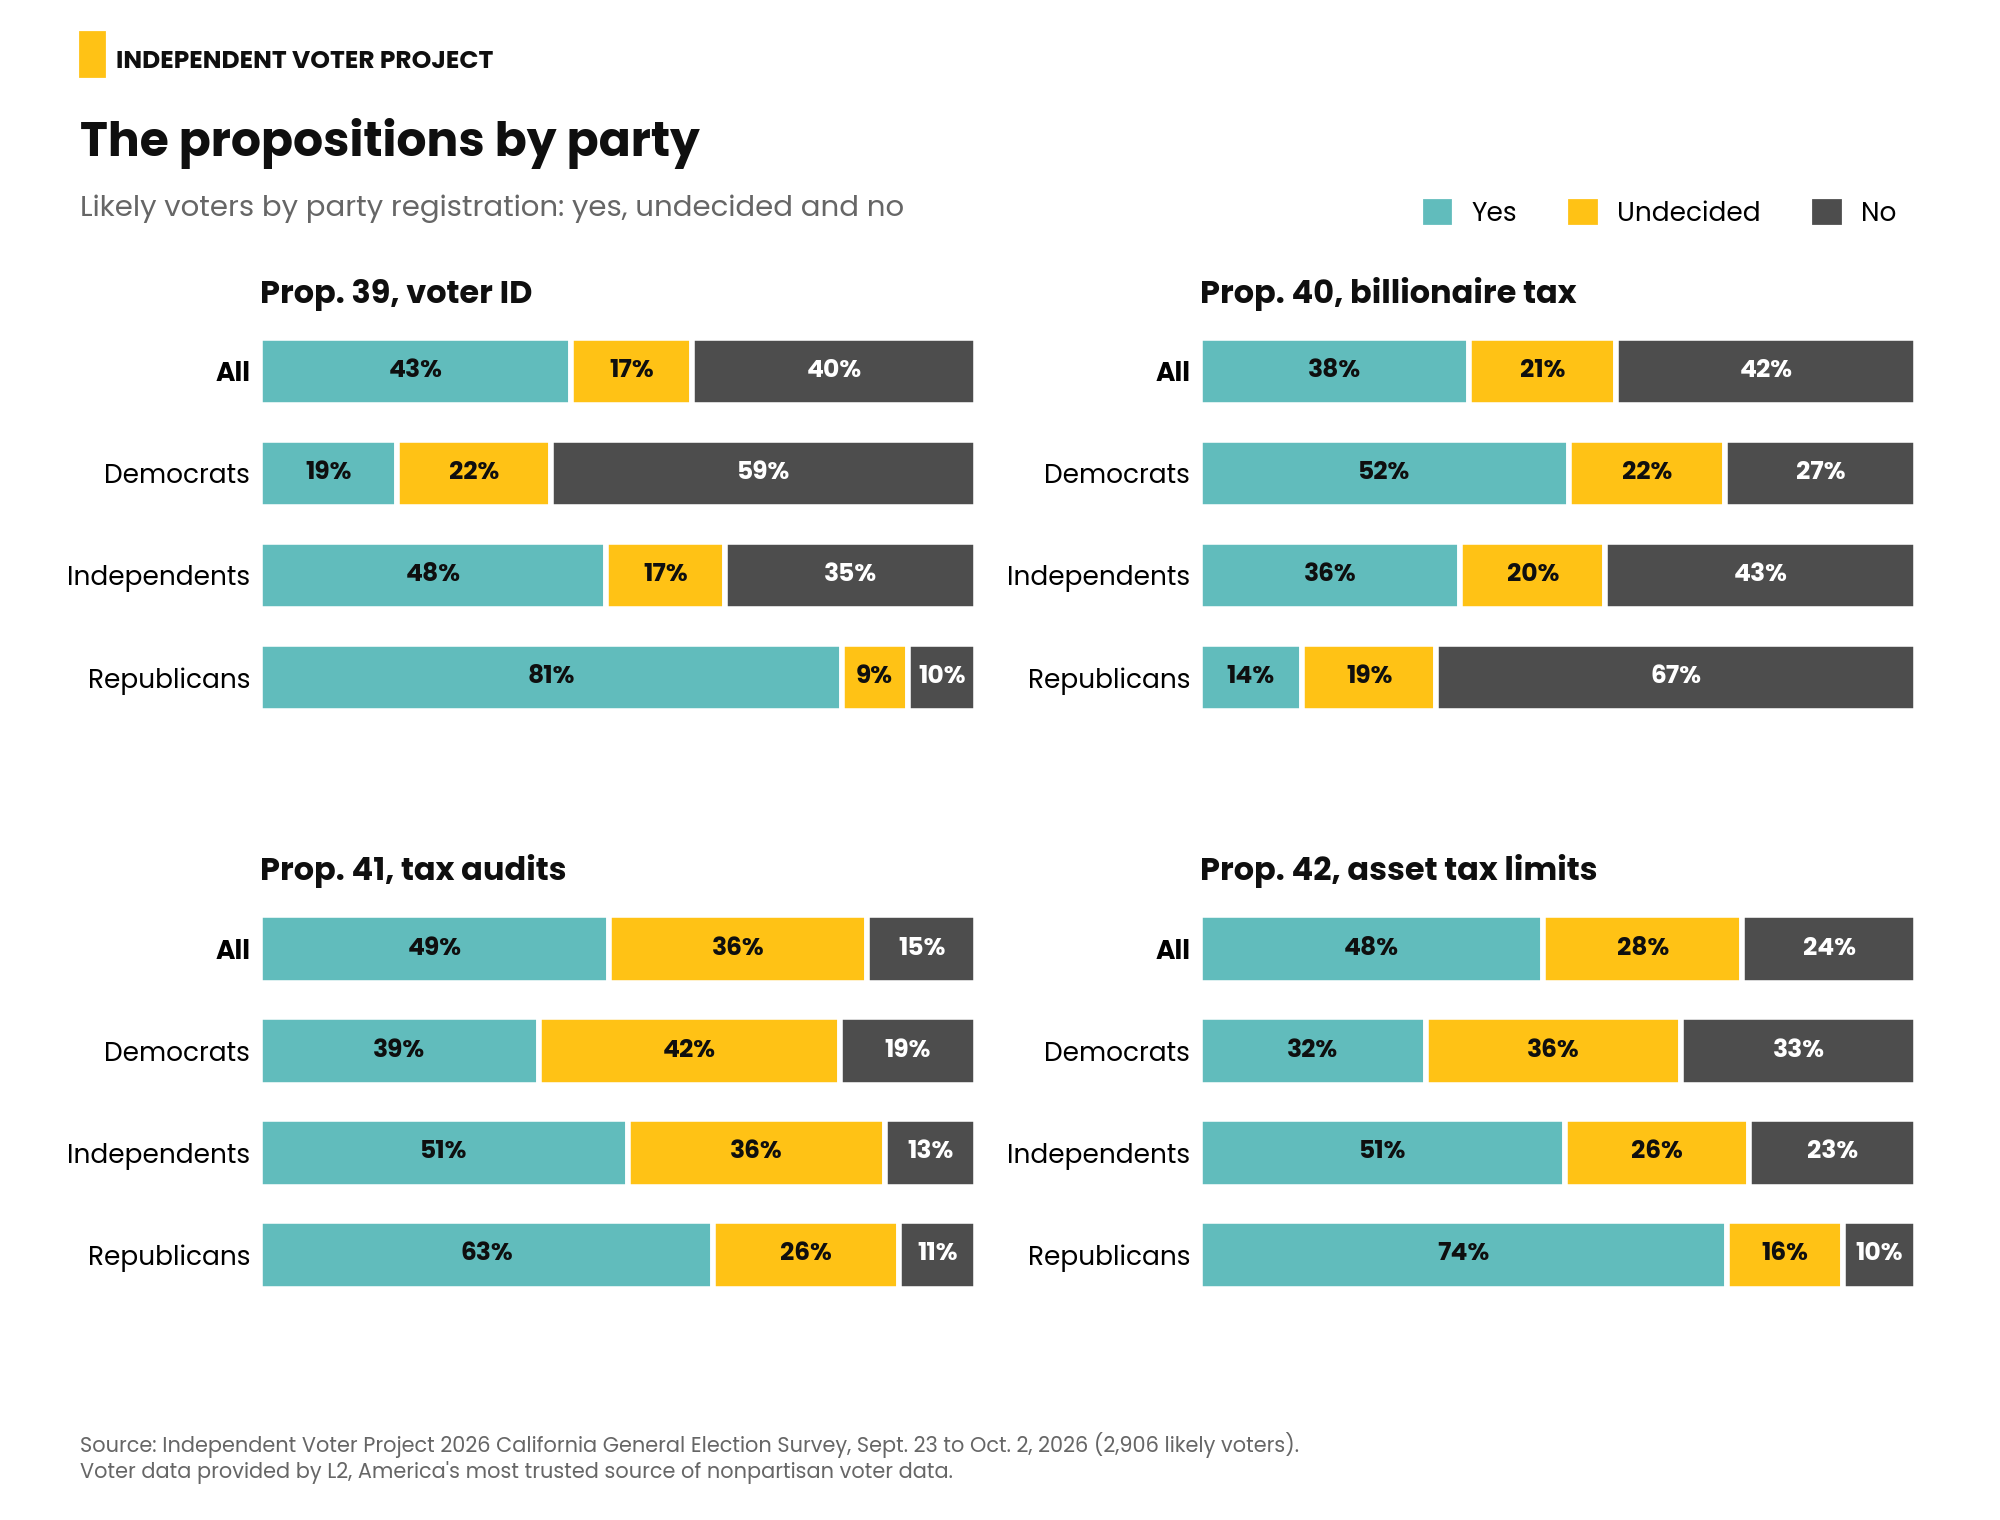
For example, Proposition 39, the voter ID measure, leads in our survey, 43 percent to 40 percent among likely voters, with 17 percent undecided. But the Republicans we surveyed have largely made up their minds, and the voters who haven't are mostly Democrats and Democratic-leaning independents. If those voters break the way similar voters already have, Prop. 39 lands at about 50 percent, a coin flip, but if they follow the usual pattern of voters who are unsure about a ballot measure and vote no, it will fail.
The survey of 2,906 likely voters was conducted Sept. 23 to Oct. 2, 2026 in English and Spanish and has a margin of error of plus or minus 2.5 percentage points. Details are in the methodology section at the end of this story. Six weeks before the June 2 primary, an IVP poll was the first published survey in the New York Times tracker to show Xavier Becerra breaking away from the Democratic field for governor. He finished first.
How the Analysis Works
For each contest, the survey separates voters into those who have decided, including those who lean one way, and those who have not. It then compares undecided voters with decided ones on party, which party they trust, age, turnout history, region, and answers to related questions, such as whether they support voter ID in principle.
A statistical model trained on decided voters estimates how undecided voters with the same characteristics would likely vote. The model correctly predicts decided voters' choices about 9 times in 10 in the governor's race and on Props. 39 and 40.
The result is not a prediction of what will happen. It estimates where each contest is likely to end up if nothing changes between now and Election Day. Campaigns, news, and turnout can all change that.
Where the Contests Are Likely to Land
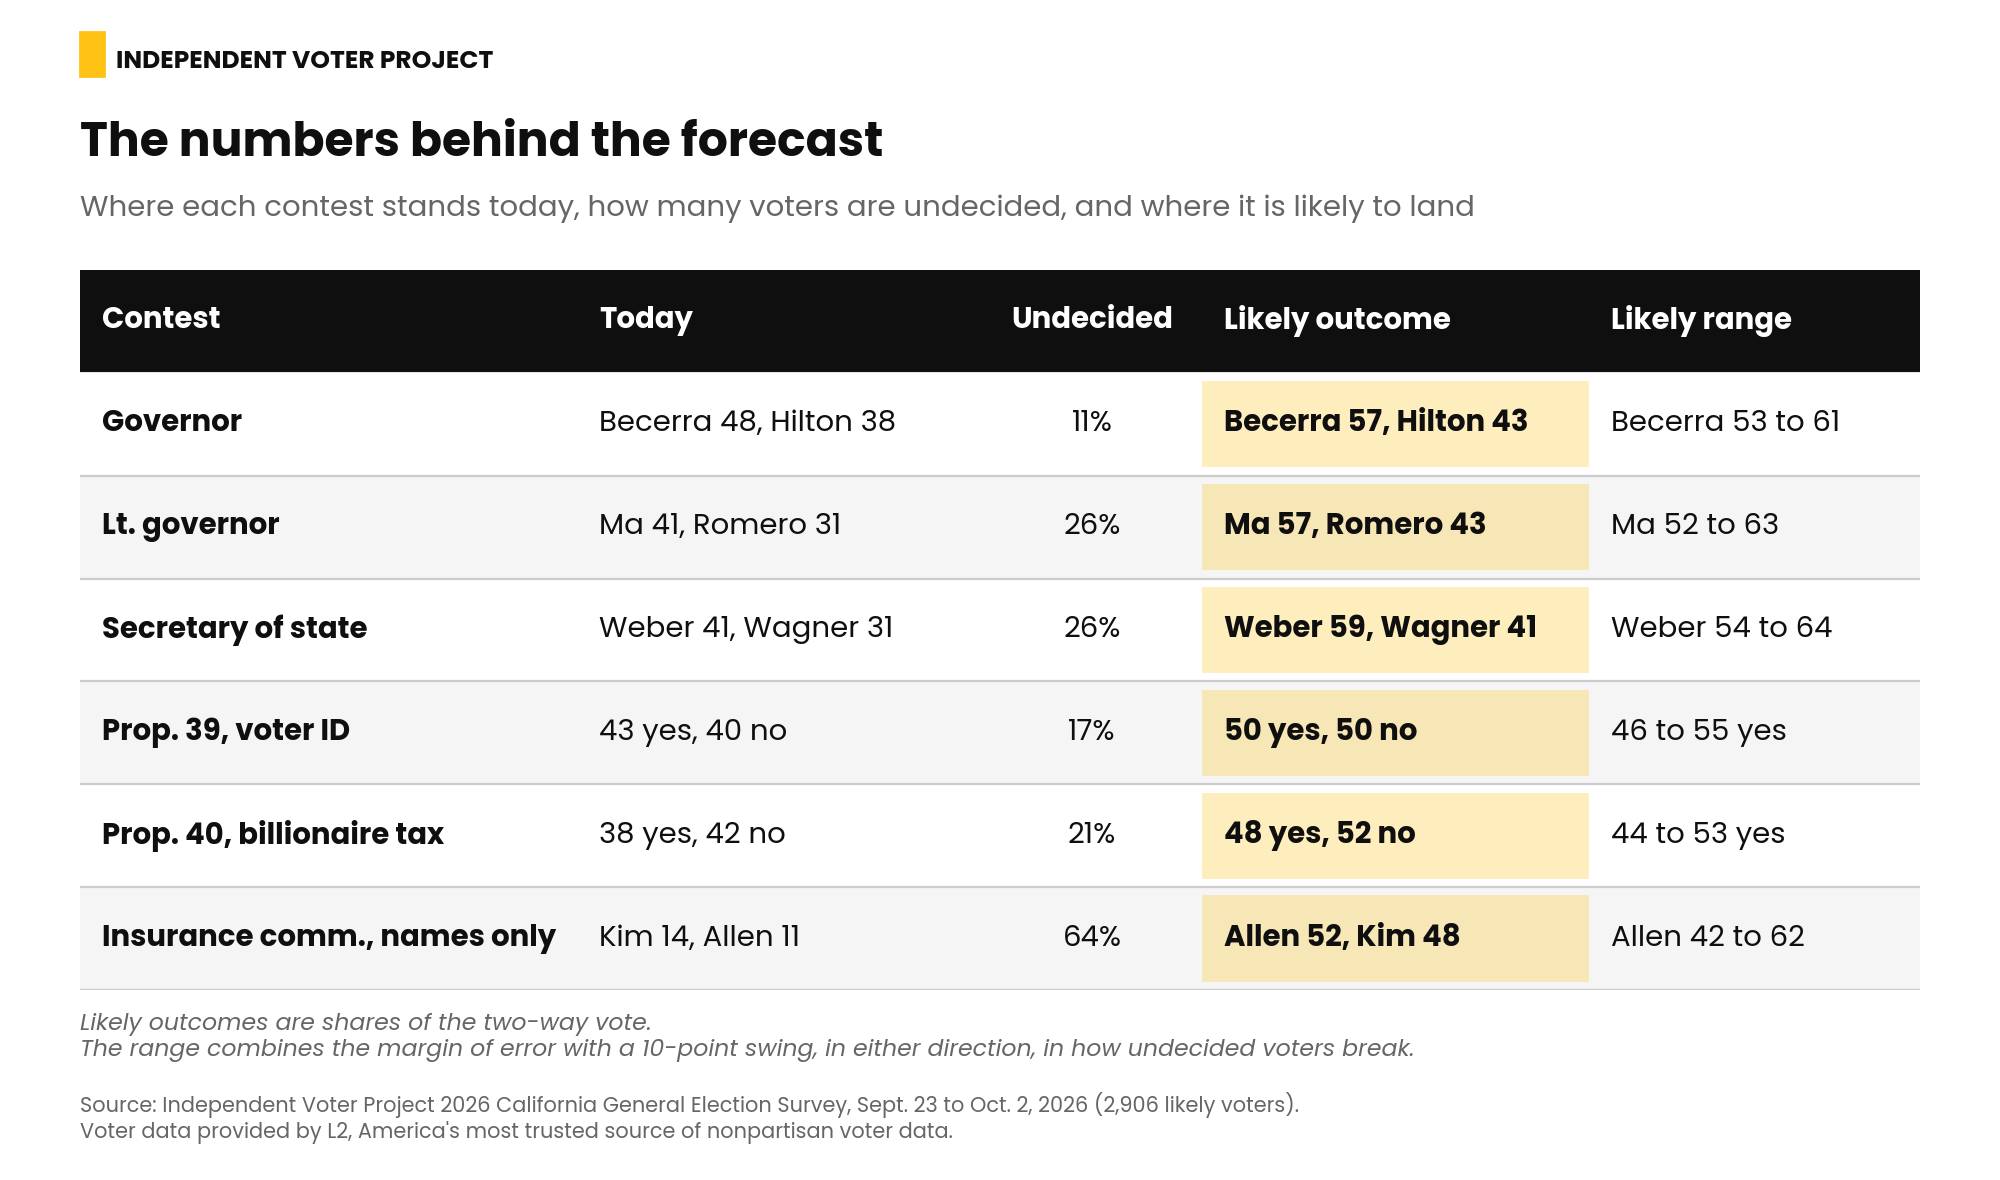
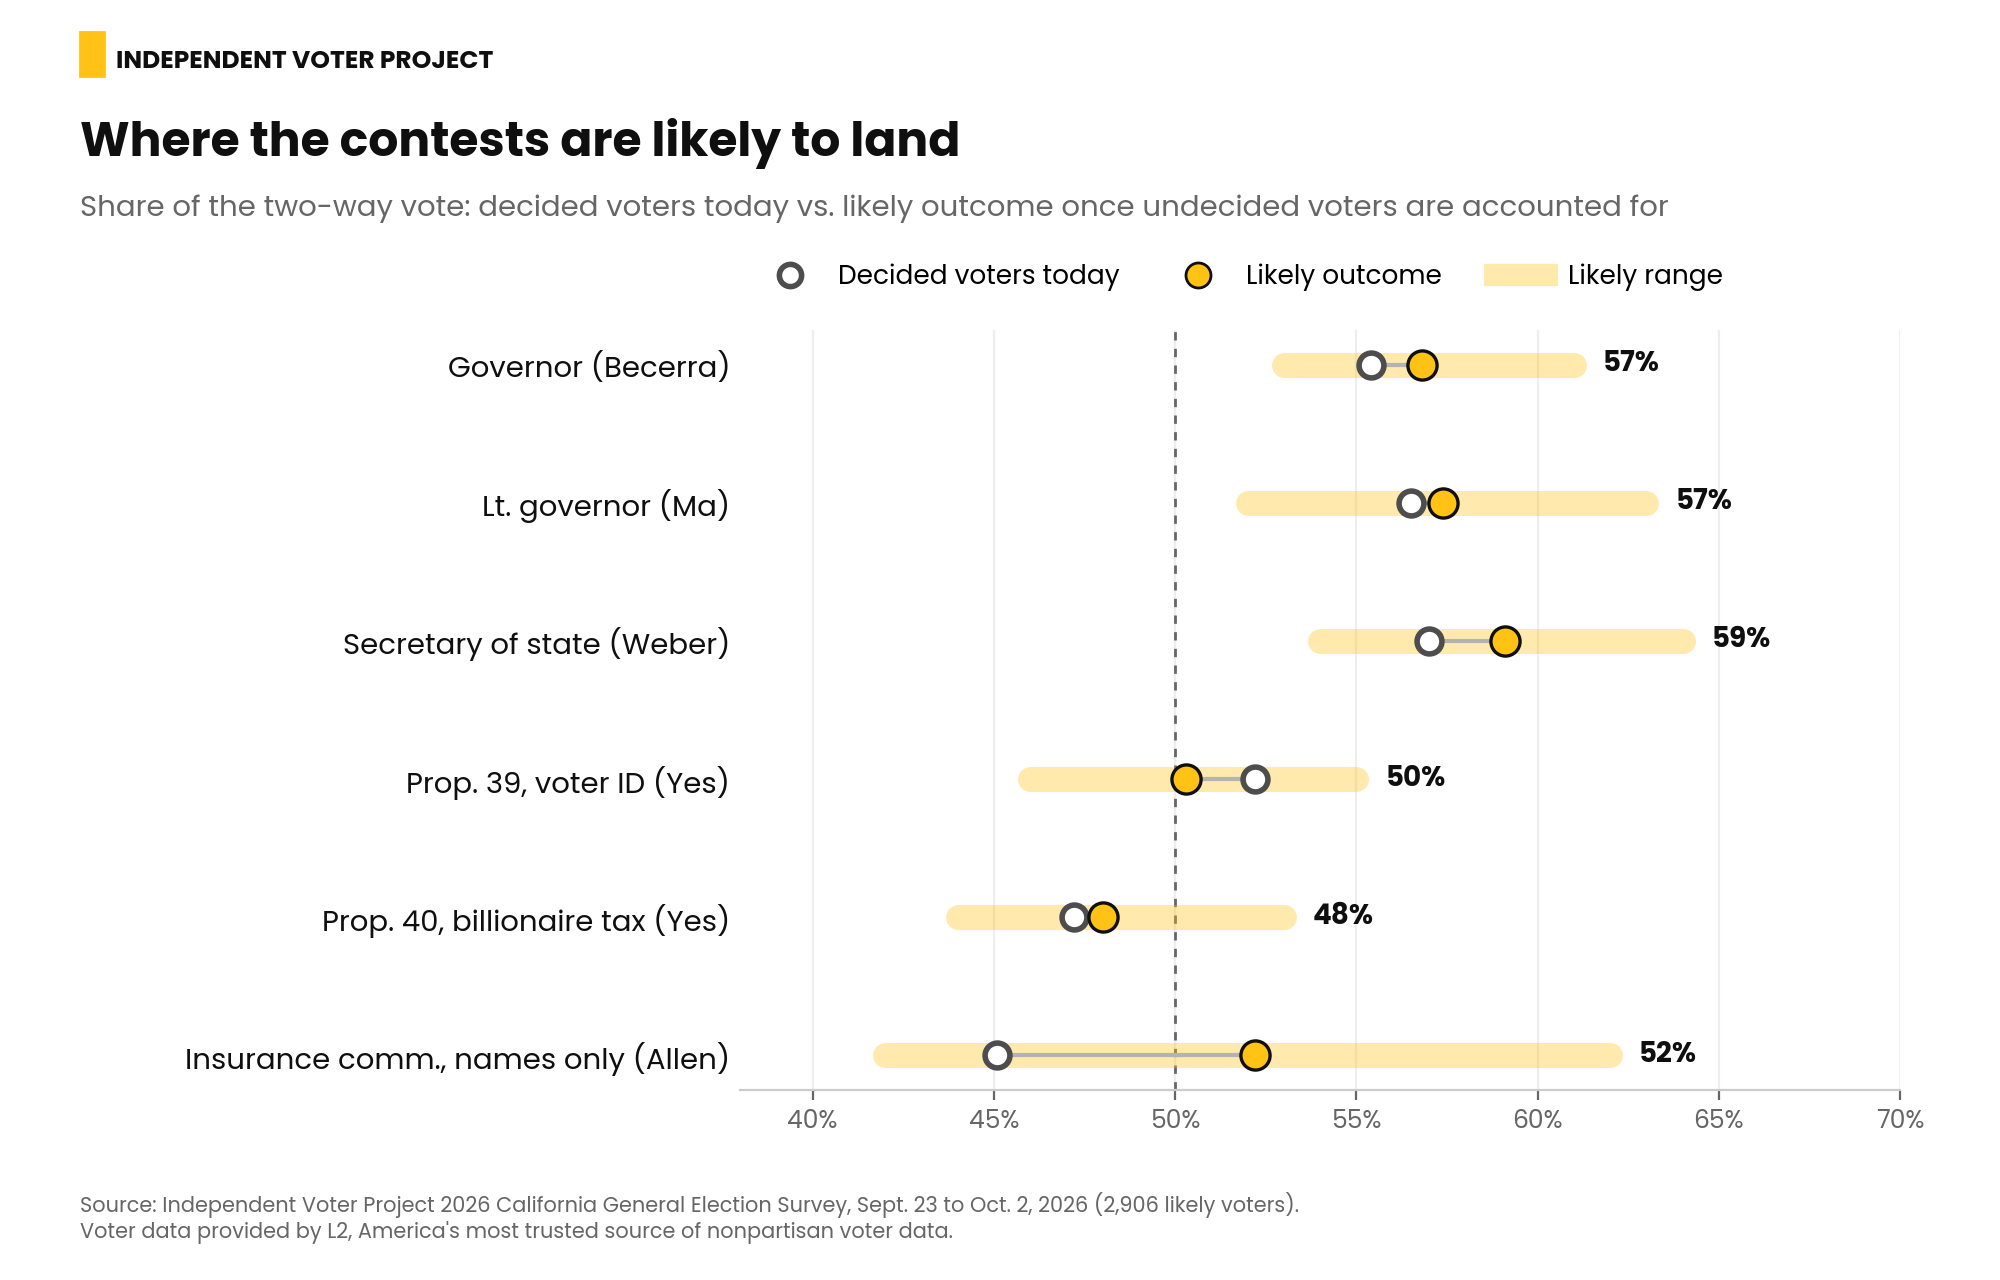
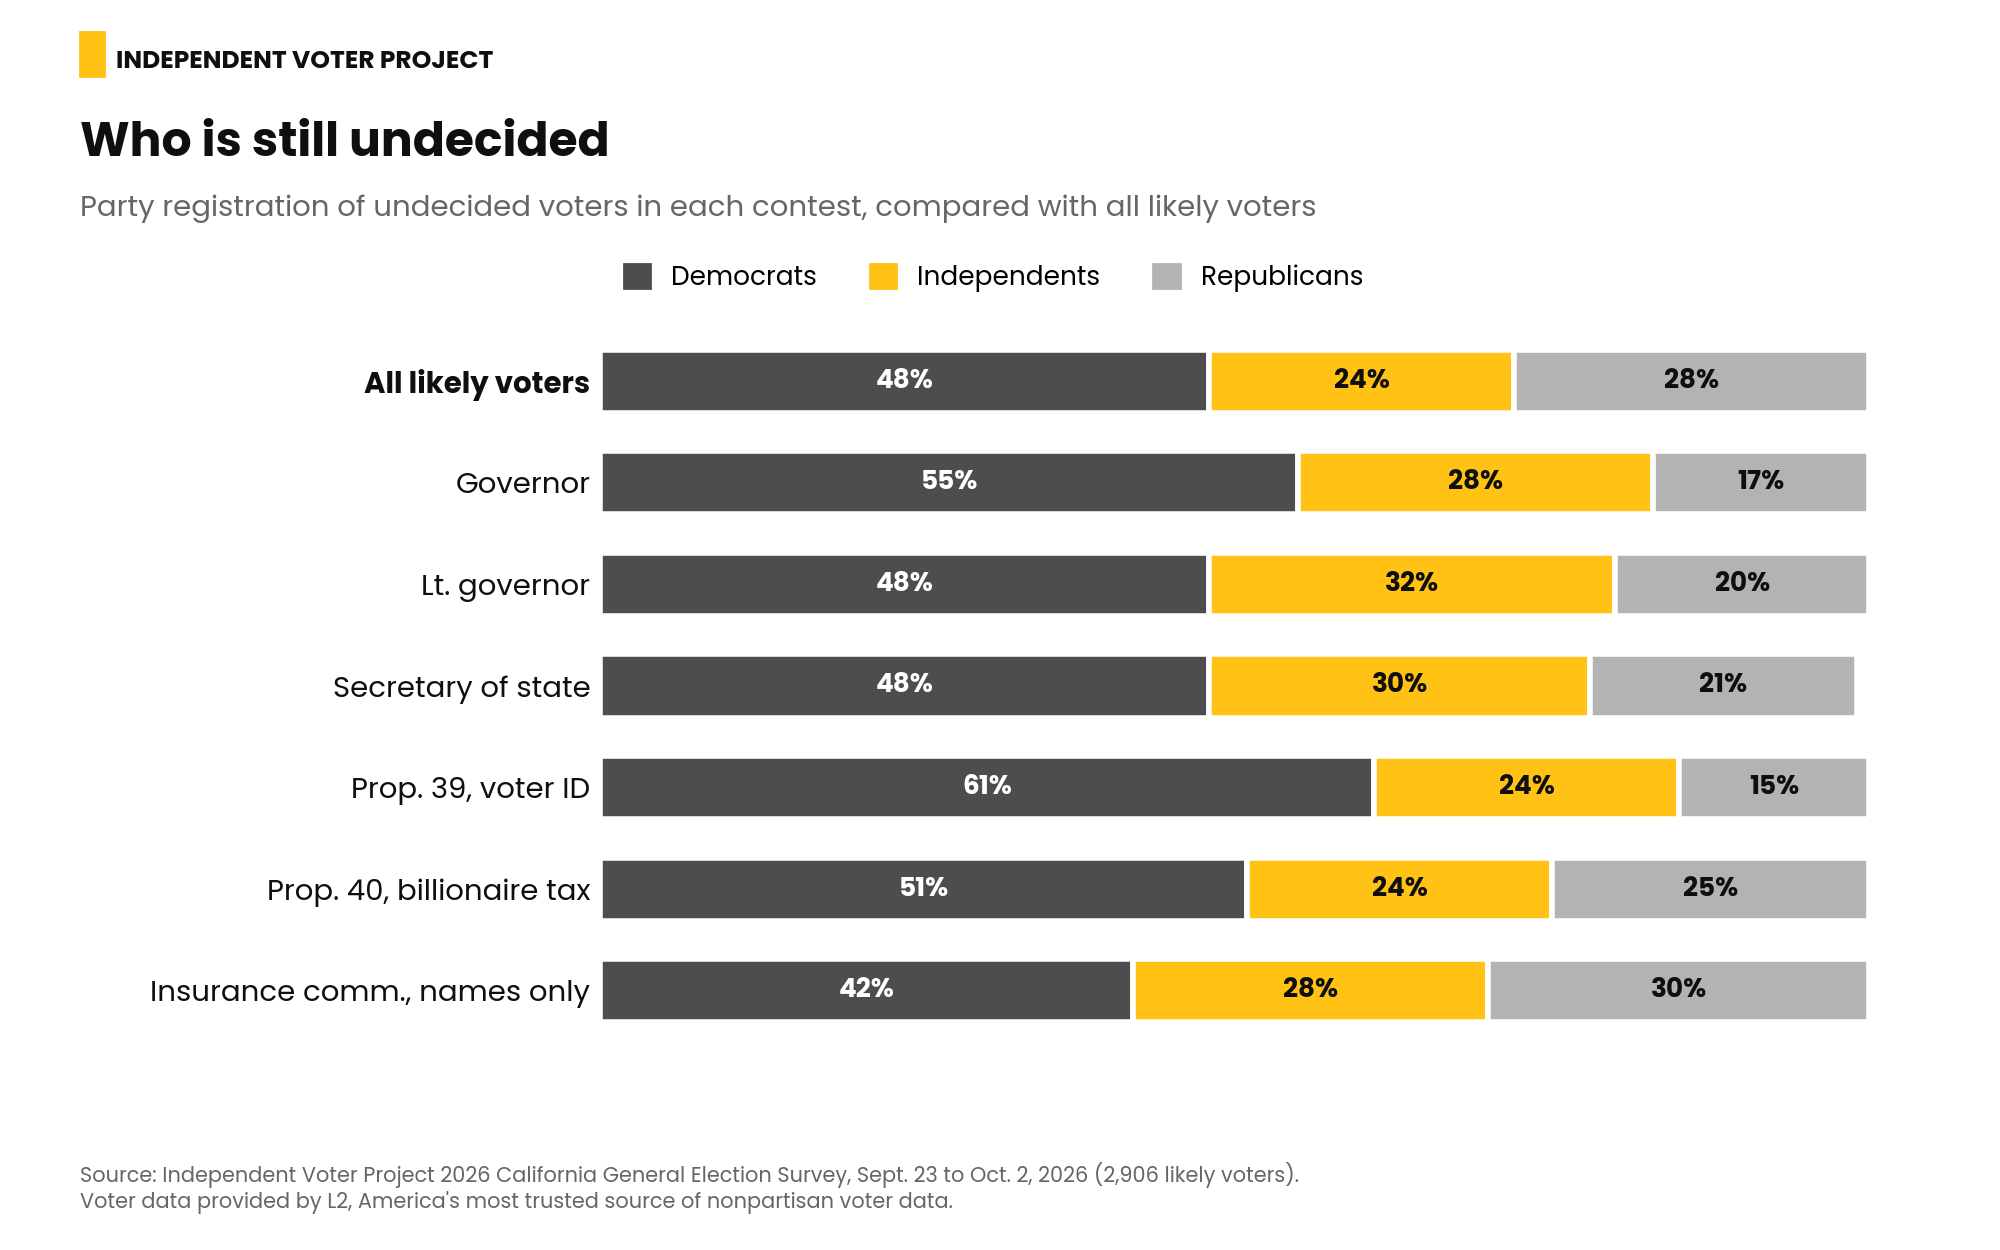
The undecided vote looks different in every contest. On Prop. 39, it is heavily Democratic. In the insurance commissioner race, it looks much like the electorate as a whole, because so few voters know either candidate.
Prop. 39: Who Is Left to Decide
Asked the Voter ID question in plain terms, 62 percent of voters support requiring a government-issued ID to vote, with a free ID card for anyone who asks. However, the measure itself is much closer. Its official title, written by the Attorney General's office, says it "Prohibits Citizens from Voting Unless They Present Government-Issued Identification."
When read this title, Republicans support Prop. 39, 81 percent to 10 percent, and only 9 percent are undecided. Democrats oppose it 59 percent to 19 percent, and more than one in five are undecided.
Of the voters still undecided on Prop. 39, 61 percent are registered Democrats, 24 percent are independents and 15 percent are Republicans. More than half of these undecided voters say they trust the Democratic Party more than the Republican Party.
To pass, Prop. 39 needs about 4 in 10 of its undecided voters, and our model estimates it gets about 41 percent. That leaves almost no cushion, and voters who are unsure about a ballot measure often vote no.
In the second wave of the survey, undecided voters were asked which way they would lean if they had to choose. Eight in 10 still could not say.
Prop. 40: Undecided Voters Don't Know Enough Yet
The idea of a one-time tax on billionaires to fund health care splits voters 40 percent to 38 percent. Prop. 40 itself trails 38 percent to 42 percent after voters hear the Legislative Analyst's Office estimate that it would raise tens of billions of dollars but could cost up to $1 billion a year in income tax revenue if wealthy residents leave California.
Its undecided voters are a different group. They are about half Democrats, a quarter independents, and a quarter Republicans. Most of them are not sure about the idea of a wealth tax at all: 62 percent of Prop. 40's undecided voters were also still undecided when the tax was described in plain terms.
To pass, Prop. 40 would need about 6 in 10 of its undecided voters. The model estimates it gets about half. In this survey, that makes Prop. 40 a toss-up that leans toward "No." PPIC's September survey found Prop. 40 ahead, and the difference between the two polls comes largely from Democratic and Latino voters, who are more supportive of the measure in PPIC's survey than in the one conducted by IVP.
Prop. 41, which would require audits of new special taxes, and Prop. 42, which would block new taxes on the ownership of financial assets and personal property, both lead comfortably. Our questions described those measures in plain terms rather than using their ballot labels, so read the size of their leads with caution. Because Props. 40, 41 and 42 conflict, the one with the most yes votes takes effect.
Insurance Commissioner: Two Democrats, and Most Voters Have No Idea
The race for Insurance Commissioner between state Sen. Ben Allen and Jane Kim, both Democrats, is the most open contest on California's ballot this November.
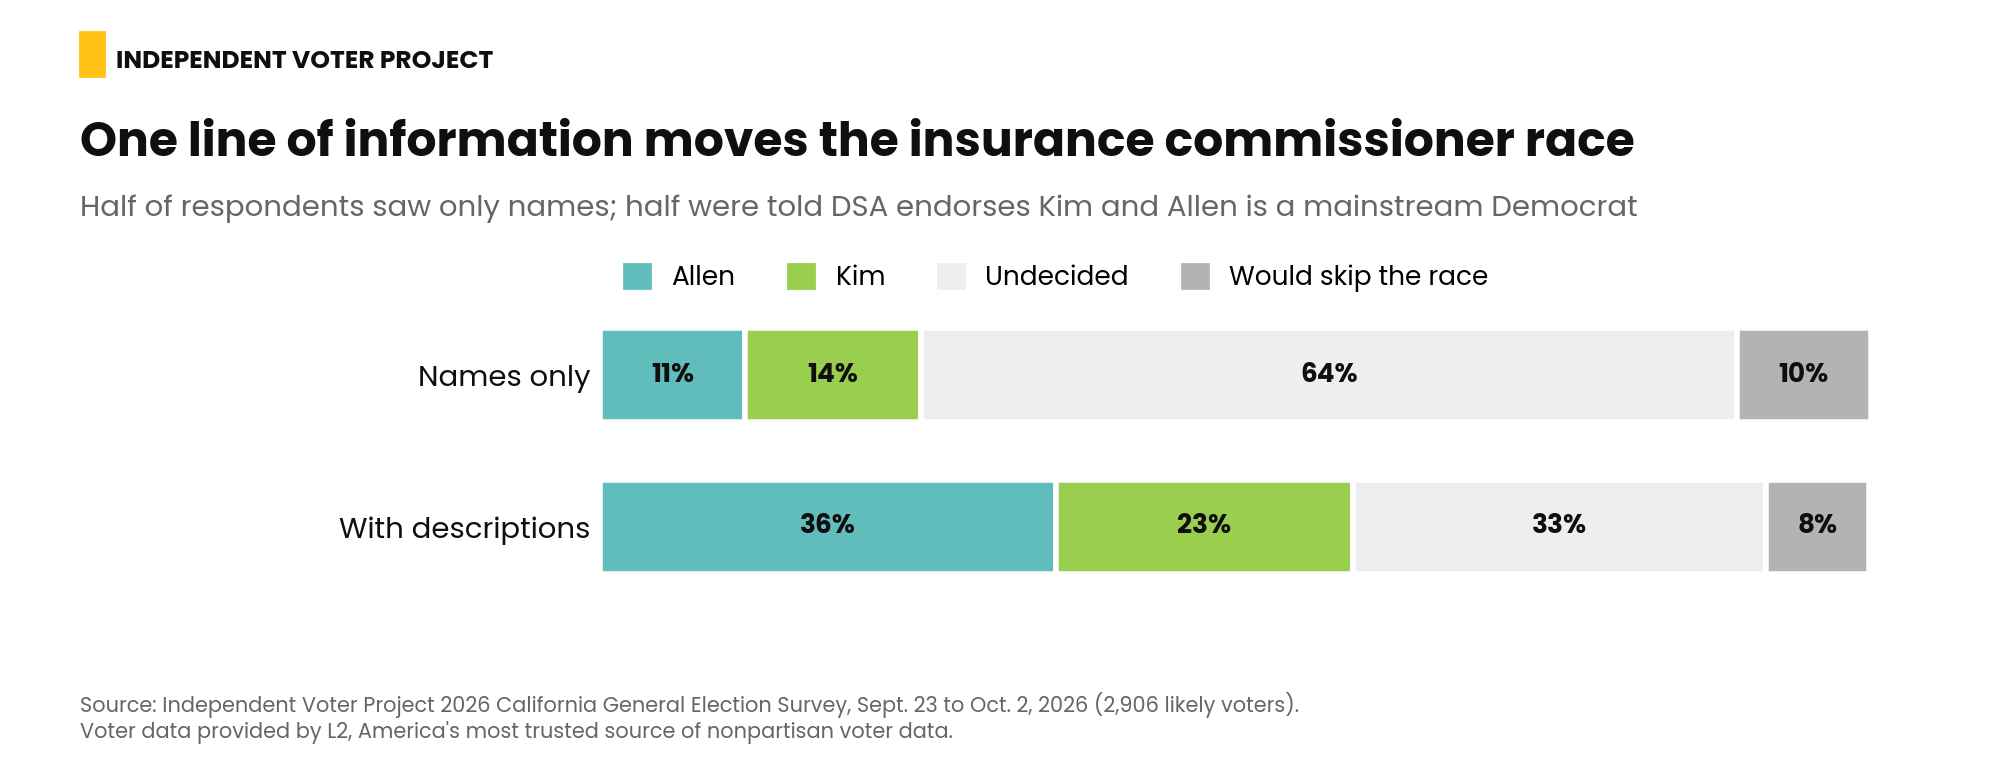
In the IVP survey, half of respondents saw only the candidates' names, as they will see them on the ballot. When given this choice, nearly two-thirds had no opinion, and the horse race was within the margin of error.
The other half of the IVP survey respondents were told that the Democratic Socialists of America endorse Jane Kim and that Ben Allen is a mainstream Democrat. With that one bit of information, Allen leads Kim, 36 percent to 23 percent, and his likely share of the two-way vote rises to about 63 percent. Republicans and independents supply most of the movement toward Allen, while Democrats stayed nearly evenly divided.
The insurance commissioner’s race will turn on what voters learn about the differences between the two Democrats on the ballot and whether Republicans, who have no candidate of their own, actually fill in the line and vote for one of the Democrats. Shown only names, nearly one in four Republicans said they would skip voting in this race.
The Los Angeles mayor's race features the same kind of matchup in a city with far fewer Republican voters. A recent UC Berkeley poll shows the DSA-endorsed challenger, City Councilmember Nithya Raman, leading Mayor Karen Bass, with a third of voters undecided.
Governor and the Down-Ballot Races
Xavier Becerra leads Steve Hilton 48 percent to 38 percent. Fifty-five percent of the undecided voters in our survey are Democrats, and the model estimates they will break about 2-to-1 Becerra’s way. Hilton would need about 9 in 10 undecided voters to win. If nothing changes, Becerra's likely share of the two-way vote is about 57 percent.
The races for lieutenant governor and secretary of state have even more undecided voters, about one in four, and the undecideds are the same makeup as in the race for governor. Democrats Fiona Ma and Shirley Weber are likely to win their elections with 57 and 59 percent, respectively, if nothing changes. Republicans Gloria Romero and Don Wagner would each need about 7 in 10 undecided voters to break in their favor to win.
Independents Are the Swing Within the Swing
Independent voters, those registered with No Party Preference, the American Independent Party, or another minor party, make up about a quarter of likely California voters. They make up a larger share of the undecided vote, close to a third, in the races for lieutenant governor and secretary of state.
Independents are not one bloc. More lean toward Democrats than Republicans: 29 percent trust the Democratic Party more, compared with 24 percent who trust the Republican Party more, and each group votes much like the party it trusts.
The largest group, though, 40 percent of independent voters, trusts neither party, even when asked to choose.
Those voters are where the close contests are most open:
- They lean slightly toward Hilton, 40 percent to 33 percent, with nearly one in five undecided.
- They support Prop. 39, 49 percent to 32 percent. That is the one group outside the Republican base where the measure has real support.
- They split on Prop. 40, 36 percent to 40 percent, with nearly a quarter undecided.
- Nearly half are undecided in the insurance commissioner race even after hearing which candidate DSA endorses.
Taken together, independents split about evenly in the governor's race.
They are also the voters most likely to leave part of the ballot blank. Only 65 percent of independents say they will vote on every race and measure, compared with 78 percent of Democrats and 75 percent of Republicans.
Which Independents Are Still Undecided
The independents who remain undecided are not the same voters from one contest to the next. The survey asked every respondent which party they trust more if they had to choose, and the answer changes the picture race by race.
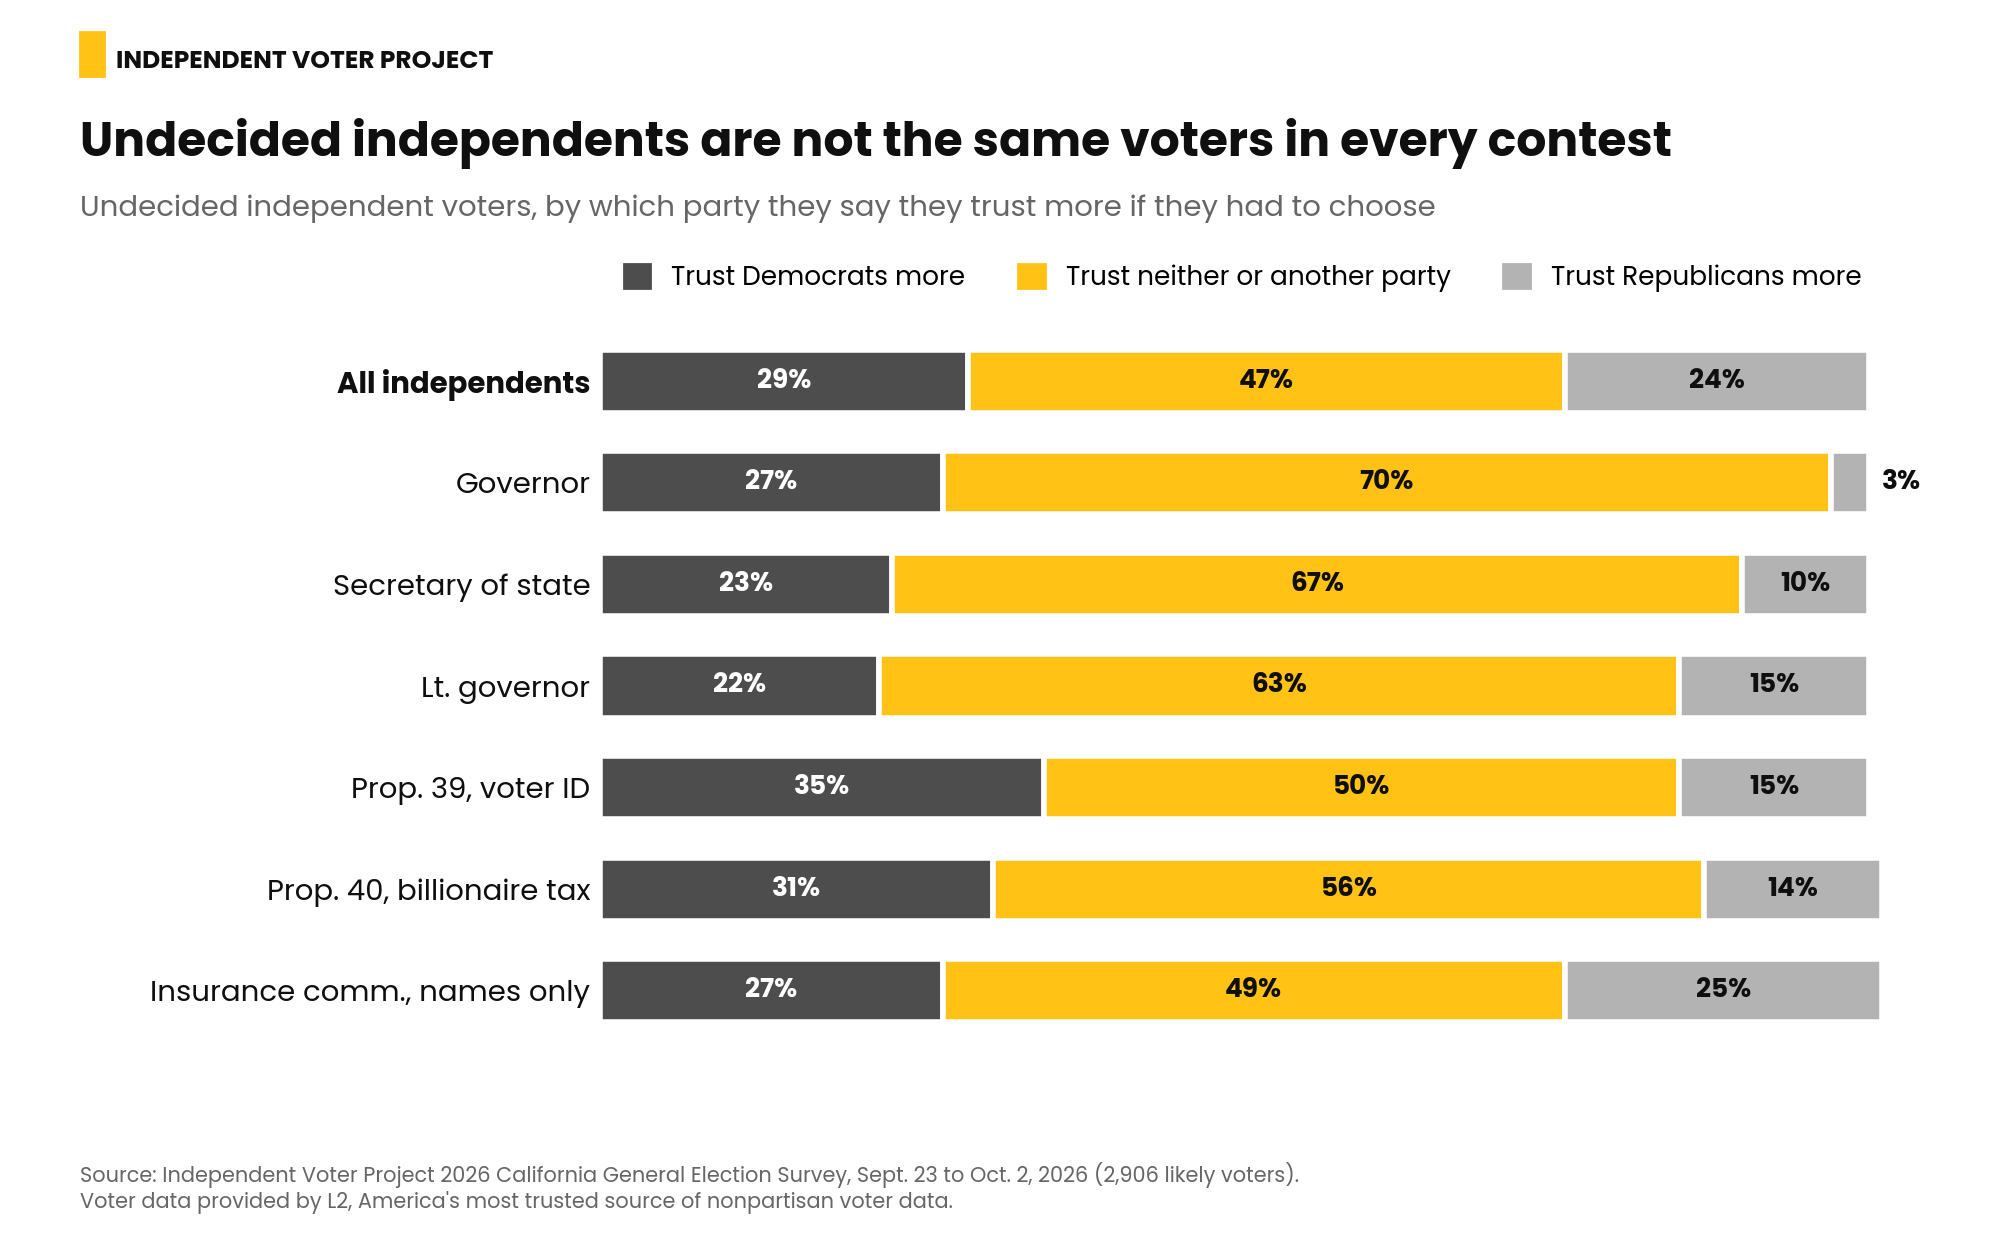
Governor. Republican-leaning independents have almost all decided. Only 3 percent of undecided independents in the governor's race trust Republicans more. Seven in 10 trust neither party. Independents who have already made up their minds split almost evenly between Becerra and Hilton, but undecided independents are likely to break about 63 percent for Becerra. Hilton's independents are already counted. The remaining voters are not his natural base.
Secretary of State. Only 1 in 10 undecided independents trusts Republicans more, and they are likely to break about 63 percent for Weber, compared with 53 percent among decided independents. The lieutenant governor's race is the exception among the candidate races: its undecided independents split about evenly, just as the decided ones do.
Prop. 39. Only 15 percent of Prop. 39's undecided independents trust Republicans more than Democrats. (Overall, 25 percent of independents trust Republicans.) The rest of the undecideds lean Democratic or trust neither party. Independents who have already made up their minds support the measure 58 percent to 42 percent. Undecided independents are likely to split about evenly. More than 4 in 10 of them are not sure about voter ID even in principle.
Prop. 40. Undecided independents on this question lean Democratic, which makes them more likely to vote yes than the independents who have already made up their minds. In other words, the conservative-leaning independent voters have already taken a side.
Insurance commissioner. With only names to go on, the undecided independents look like independents as a whole, including Republican-leaning voters. Almost no one knows the candidates, so party trust has not sorted anyone yet. That is why the race moves so sharply once voters learn who DSA endorses.
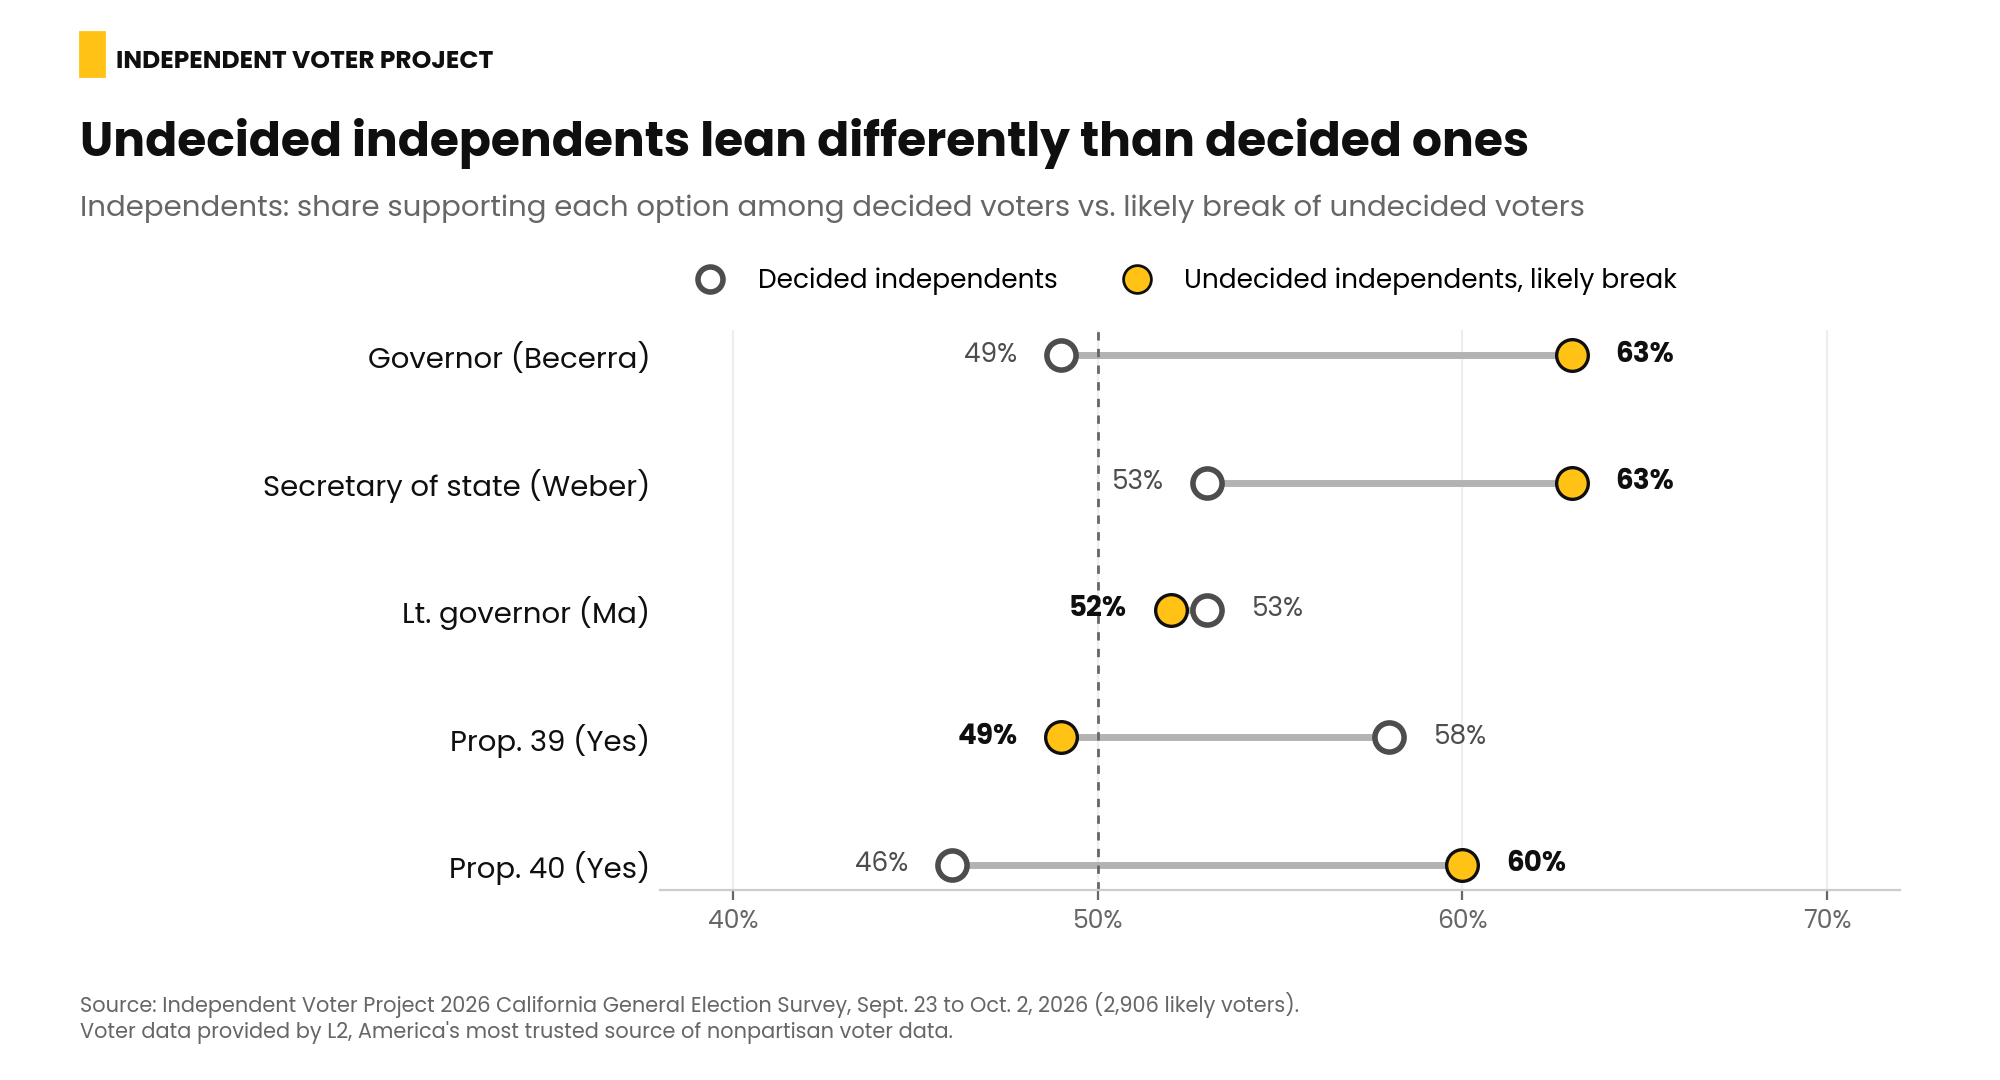
The groups of undecided independents are small, from about 80 to 230 respondents depending on the contest, so these figures show direction more than precise size.
What Would Change the Likely Outcome
Each of these estimates assumes nothing changes. Here is what the data suggests it would take for the result to come out differently.
- For Prop. 39 to pass, its supporters would need to reach Democratic and independent voters who like voter ID but don't trust the people behind the measure. Few of its undecided independents lean Republican, so a message built for Republican-leaning voters will not reach them. More than a quarter of its undecided voters support voter ID but distrust Republicans to carry it out. Another 4 in 10 aren't sure about voter ID at all. Opponents need only keep those voters in the undecided camp.
- For Prop. 40 to pass, and it is close enough to go either way, its supporters would need to give undecided voters a reason to support a tax most of them haven't formed an opinion on, and do it with Democrats and independents. Republican undecided voters are likely to vote no.
- For Hilton to win, he would need nearly all undecided voters, including Democrats. Nearly all Republican-leaning independents have already decided, so the independents still available to him trust neither party or lean Democratic. He would have to win them by a wide margin.
- In the insurance commissioner race, the outcome depends on what voters learn. If voters know which candidate DSA endorses, Allen is favored. If the race stays a matter of names, it is a toss-up, and turnout among younger voters, who lean toward Kim, matters more.
June Showed What Unexpected Turnout Can Do
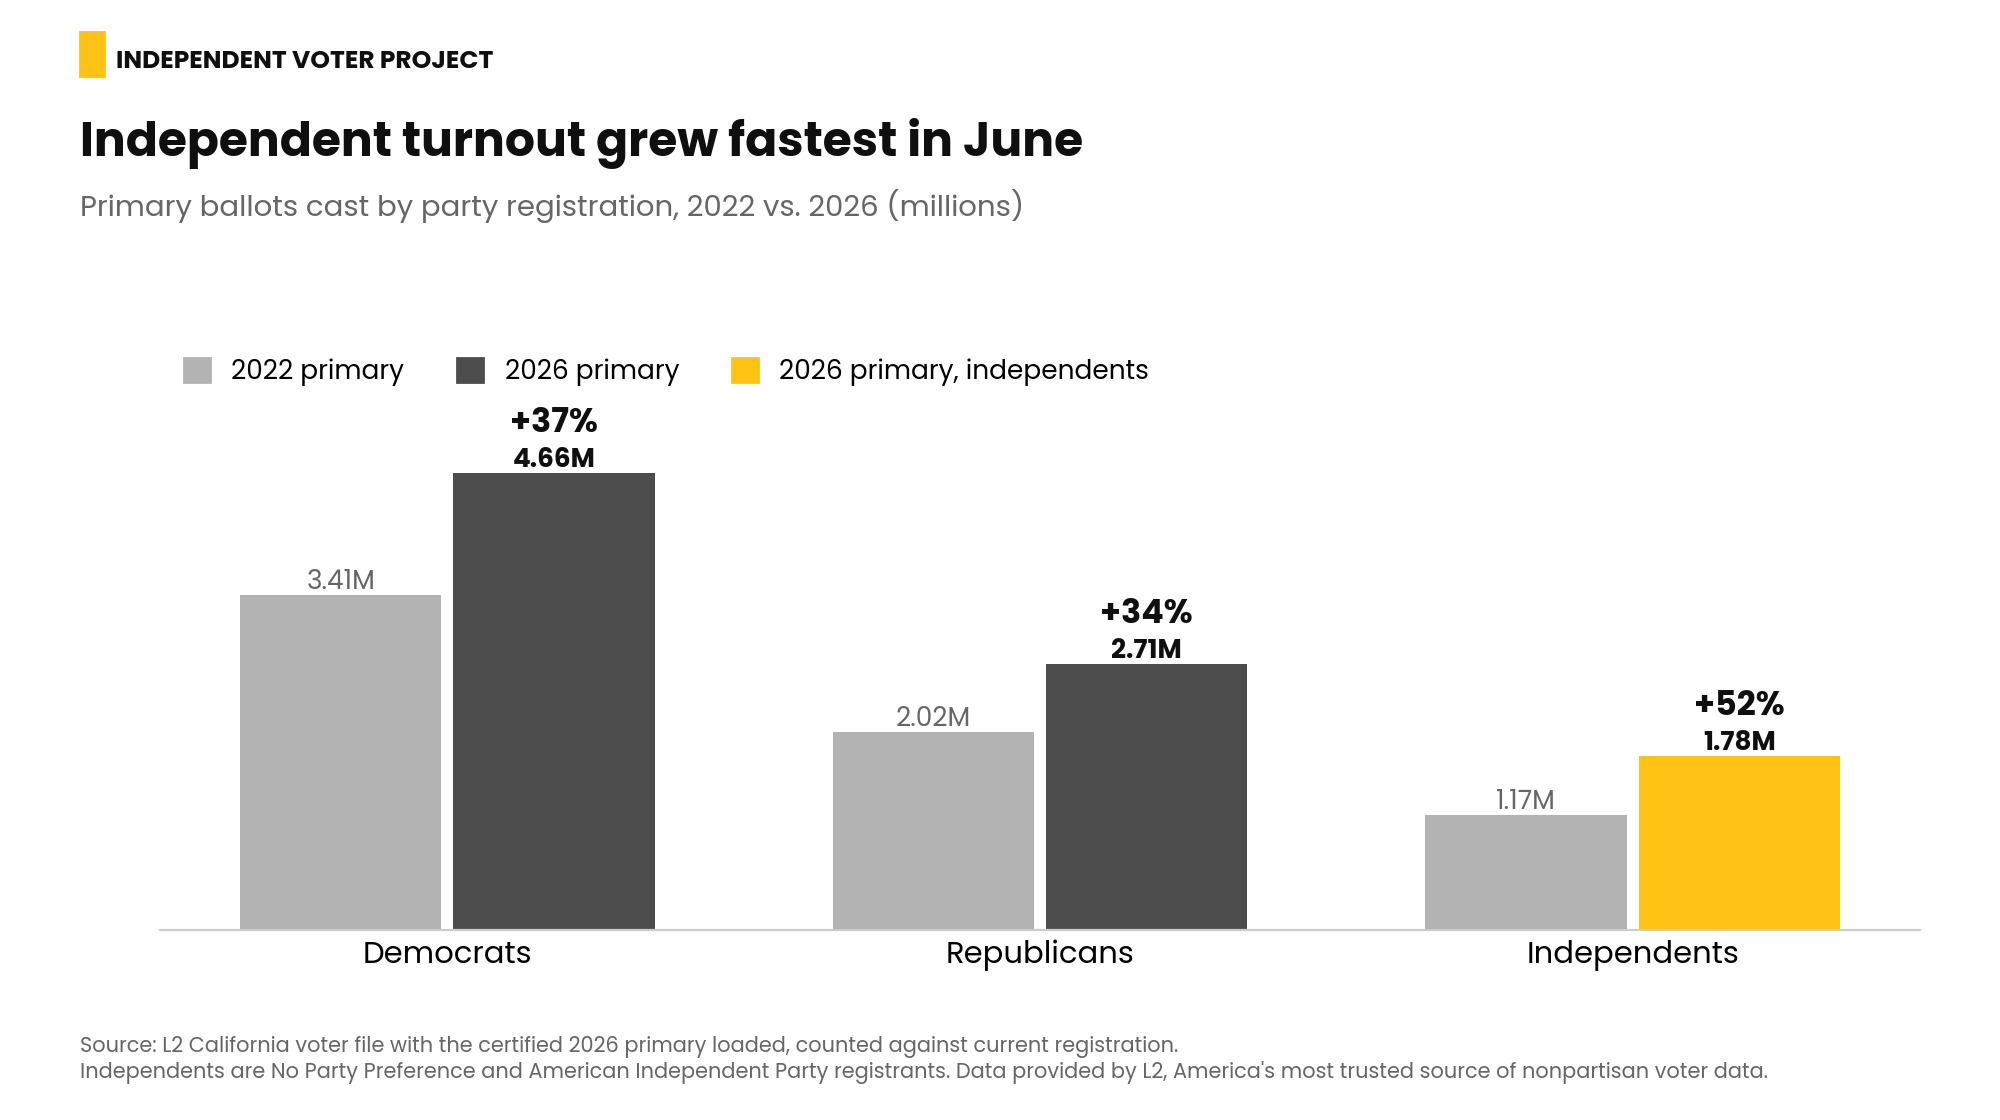
Small shifts in who votes can decide close races. In June, independent turnout grew faster than Democratic or Republican turnout. Voters registered with No Party Preference or the American Independent Party cast 1,775,806 ballots, up 52 percent from 1,170,455 ballots cast in the 2022 primary. Democratic ballots rose 37 percent, and Republican ballots rose 34 percent, according to the L2 California voter file. In the governor’s race, Becerra finished comfortably first, while turnout ran higher than models built on past elections predicted.
In the weeks before that vote, the Independent Voter Project, which authored California's top-two primary law and co-publishes IVN, ran the state's first statewide program to inform independent voters about an effort to repeal the top-two primary. Its message: if you don't vote now, they may not let you vote next time. The program reached about 2.8 million independent voters. Those results show independents voted in larger numbers than in 2022. They do not, by themselves, show how much of that increase the program caused.
How This Survey Compares With Other Polls
Other recent polls, including the Public Policy Institute of California's September survey, show a wider margin for Becerra and different results on Props. 39 and 40. Part of the difference is who they count as a likely voter and as a party member.
PPIC asks respondents how they are registered and how often they vote. This survey takes both details from the state voter file. Party comes from each voter's registration record, and the likely electorate is defined by actual voting history: at least two of the last four general elections or the June primary.
Each approach has trade-offs. People tend to overstate how often they vote, and some misremember their registration status. Relying on voting records can miss newer voters, though this survey includes newly registered voters who cast a ballot in June. Those who registered but skipped the primary are left out, on the view that voters who passed up their first chance to vote are less likely to turn out in November.
This survey also offers "not sure" as an answer, so it reports more undecided voters. Republicans look nearly identical in both polls. The differences are concentrated among Democrats, Latino voters and the undecided.
Four Weeks Out
The close contests will be decided by the voters the parties spend the least effort reaching: independents, occasional voters and voters who have not heard enough information to make a choice. In most races, the makeup of those voters already points to a likely outcome. Whether that outcome holds depends on who reaches them first, and with what information.
Methodology
The 2026 California General Election Survey was sponsored by the Independent Voter Project and conducted by IVC Media from Sept. 23 to Oct. 2, 2026. It includes responses received through 10 a.m. on Oct. 2.
Who was surveyed. The sample is 2,906 California registered voters who voted in at least two of the last four general elections or in the June 2026 primary. That record of past voting, not a respondent's stated intention to vote, is the survey's model of the November electorate. We include newly registered voters if they voted in the June primary; we exclude those who have not yet voted in any election. We also obtain party registration from the voter file rather than from what respondents report. We drew the sample directly from the L2 California voter file.
How it was conducted. We invited voters by text message with a personal link, and they completed the survey online. We invited voters in households the voter file identifies as Spanish-speaking in Spanish; 141 respondents answered in Spanish. We matched every response back to the voter's record and removed duplicate and incomplete responses. The survey did not ask demographic questions. Age, party, race and ethnicity, region, and household language come from the voter file.
Weighting. Results were weighted to match the full population of about 15.2 million voters who meet the vote-history standard, including those without a cellphone, by age, race and ethnicity, gender, party registration, region, urbanicity, education, and household language. The weights also adjust for which voters were invited, whose messages were delivered, and who tended to respond. The weighted electorate is 48 percent Democratic, 28 percent Republican, and 24 percent independent or other; 17 percent live in Spanish-speaking households.
Margin of error. The margin of error is plus or minus 2.5 percentage points at the 95 percent confidence level, adjusted for weighting. It is about plus or minus 3.5 points for the two questions asked in split versions, including the insurance commissioner test, and larger for subgroups: 3.5 points for Democrats, 4.8 for Republicans and 5.2 for independents.
Undecided voters. "Not sure" was offered as an answer on every question, in a randomized position. That is deliberate. It produces more undecided responses than surveys where respondents must volunteer that they don't know, and it is what makes it possible to study who the undecided voters are.
Likely outcomes. The likely outcomes in this story are estimates, not forecasts. For each contest, a statistical model was fitted to voters who have made a choice, using their party registration, the party they trust more, age, race and ethnicity, gender, region, voting history, their stated intention to vote and finish the ballot, and their answers to related questions. The model then estimated how undecided voters with the same characteristics would likely vote. Ranges combine the margin of error with a 10-point swing in how undecided voters break. The insurance commissioner estimates are much less certain than the others, because most voters who saw only the candidates' names were undecided.
Limitations. This is a text-message survey that voters chose to answer. About 3 in 1,000 voters who were sent an invitation completed it, and voters without a cellphone on file, about 28 percent of the target population, are represented only through weighting. Weighting reduces but cannot fully remove differences between voters who responded and those who did not. The margin of error does not capture those differences or the effects of question wording.
Independent voters include No Party Preference, American Independent Party, and all other minor-party registrants. All results are weighted percentages unless otherwise noted. June turnout figures are from the L2 California voter file with the certified 2026 primary loaded, counted against current registration. Data provided by L2, America's most trusted source of nonpartisan voter data.
Full technical methodology, including complete question wording in English and Spanish. Toplines and crosstabs.
Candidate photos used with this poll: Xavier Becerra, U.S. Department of Health and Human Services (public domain); Steve Hilton, Policy Exchange, CC BY 2.0, via Wikimedia Commons.