
LOS ANGELES, Calif. - A new Independent Voter Project poll finds that the LA mayoral race is a three-way contest among general-election voters. The only catch is that those voters may not be the ones who decide who's on the November ballot.
That decision belongs to whoever shows up to vote in the primary.
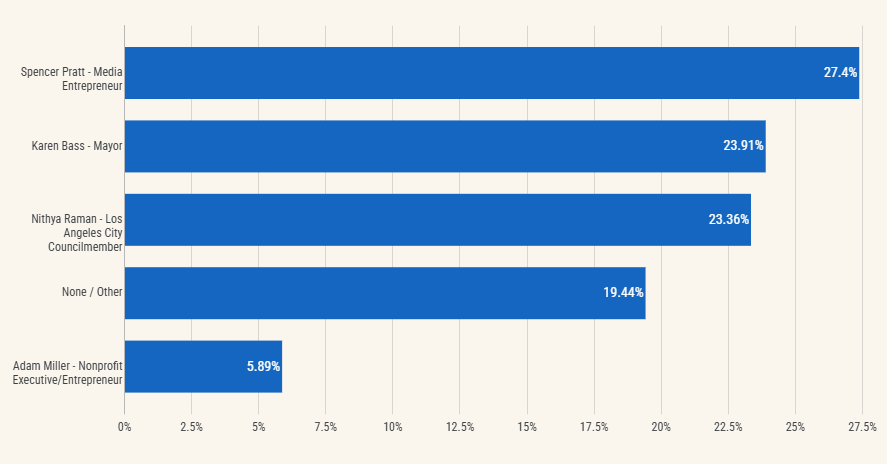
If the November general election were held today with the same electorate that turned out in 2022, Spencer Pratt would lead at 27%, followed by Karen Bass at 24% and Nithya Raman at 23%. Adam Miller trails at 6%, with 19% picking "None / Other."
But the primary electorate looks nothing like the general electorate. It's smaller, older, and more partisan. Those voters decide which two candidates the rest of LA gets to choose between in November.
This poll is weighted to match LA's general election turnout: younger, more diverse, and significantly more independent than the primary. If you want to understand what LA's broader electorate actually prefers, these are the numbers.
If you want to know who wins the primary, this isn't that poll.
The Race Breaks Down by Coalition, Not by Citywide Preference
Spencer Pratt leads the overall race, but his support is concentrated in a bloc that historically underperforms in primaries. Among Republicans, he is the only candidate with meaningful support: 75% back Pratt, with no other candidate clearing 5%.
Among independents (No Party Preference and American Independent), Pratt leads with 39%, well ahead of Raman at 19% and Bass at 6%.
They not like us pic.twitter.com/78hducHDUE
— Spencer Pratt (@spencerpratt) April 29, 2026
That's a dominant position in a large voting bloc. Republicans and independents make up 35% of LA's general election electorate in this model. The question is whether they show up in the primary at anything close to that rate.
Karen Bass leads among Democrats in this poll, with 34% support. Raman trails by four points at 30%. Bass's coalition is older and more Black than Raman's. The remaining Democratic vote splits between None/Other (18%) and Pratt (12%).
I clashed with Trump's ICE agents and Angeleno's locked arms to protect our neighbors.
— Karen Bass (@KarenBassLA) April 24, 2026
I achieved the first two-year drop in homelessness ever.
I battled red tape and insurers to help families rebuild from fires.
Now, I haven't always got it right. There's more work to do.… pic.twitter.com/NUArlCsFF9
Nithya Raman runs competitively overall on the strength of younger voters. She leads decisively among voters under 40: 46% among 18–29-year-olds and 42% among 30–39-year-olds. She runs second to Bass among Democrats but struggles among older voters and outside the party.
LA mayor candidate @nithyavraman: “I don't think the choice right now needs to be between our broken status quo that is motivated by these really political decisions around some of the most important issues facing Los Angeles, and between a Maga Republican.” pic.twitter.com/hIp23RH1g9
— BTC Clips (@BTC_clips) May 11, 2026
Adam Miller has not yet broken through with any subgroup.
The structure is clear. Pratt owns Republicans and independents. Bass owns older Democrats. Raman owns younger Democrats. Whoever turns out in the primary decides which two of those coalitions advance to November.
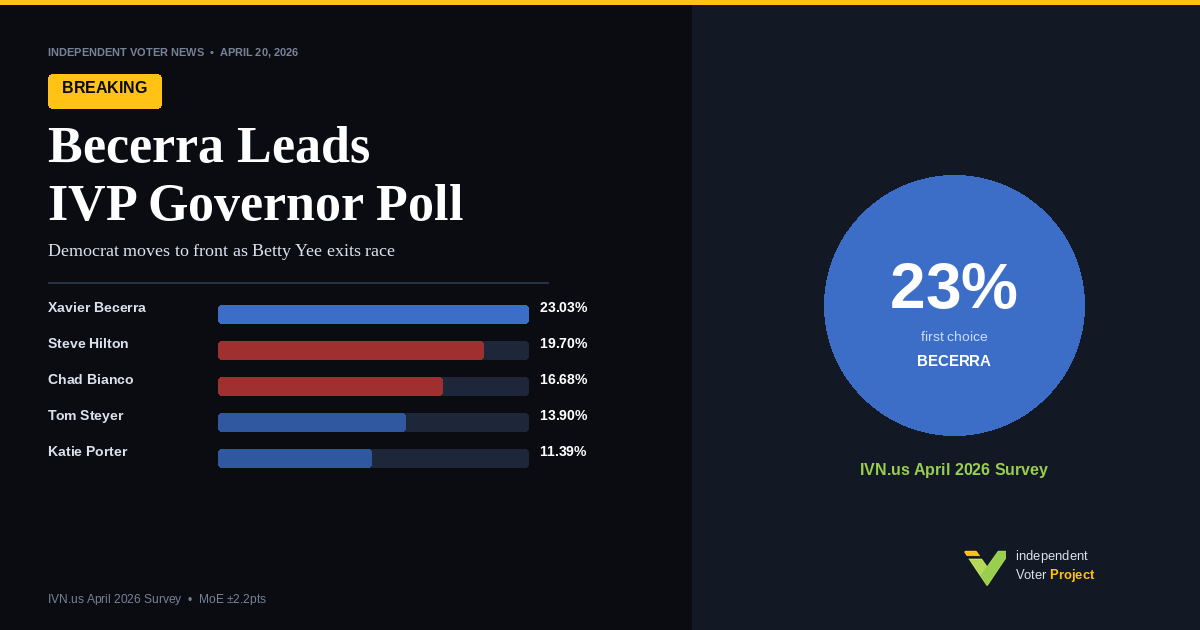
Governor: Becerra Leads in LA, But This Is a City Poll, Not a Statewide Forecast
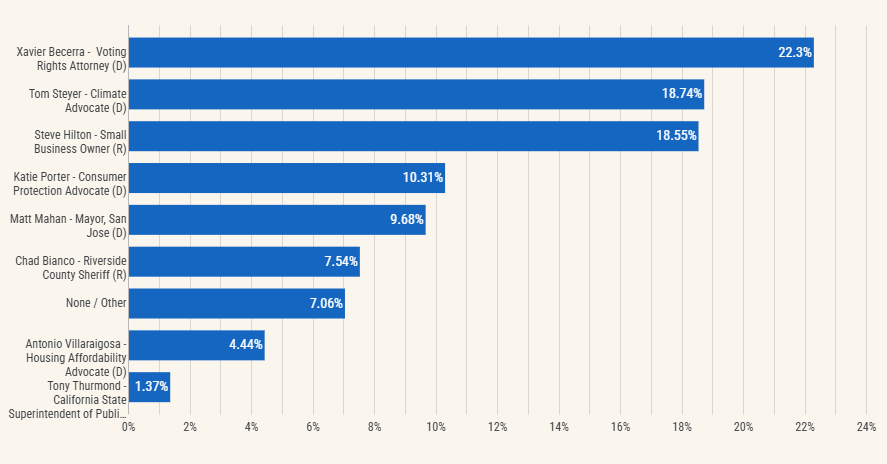
Among LA City voters, Xavier Becerra leads with 22%, followed by a statistical tie between Tom Steyer (19%) and Steve Hilton (19%). Katie Porter and Matt Mahan follow at 10% each, with Bianco at 8%, Villaraigosa at 4%, and Thurmond at 1%. About 7% selected None/Other.
This is not a statewide projection. California's gubernatorial race will be decided by voters across the entire state. These numbers describe only LA City voters.
LA Democrats split fairly evenly between Becerra (31%) and Steyer (24%), with the rest dividing among Porter, Mahan, and others. Republicans in LA overwhelmingly back Hilton (58%), with Bianco a distant second (33%).
Independents are more split: Hilton leads at 31%, Steyer at 16%, Becerra at 12%.
Voters Think LA Is on the Wrong Track. California Gets a Softer Read.
Fifty-four percent (54%) of LA City voters say LA is headed in the wrong direction. Only 17% say the right direction. Twenty-nine percent (29%) are in the middle.
Forty-seven percent (47%) say California is headed in the wrong direction, while 26% say it is headed in the right direction and 27% in the middle. That's a meaningfully less negative assessment of the state than of the city.
The partisan gap is dramatic. Republicans are overwhelmingly negative: 95% say LA is on the wrong track, 94% say the same of California. Democrats distinguish between the two: they lean negative on LA (40% wrong direction vs 25% right direction) but lean positive on California (36% right direction vs 30% wrong direction).
Independents lean negative on both (67% wrong track on LA, 62% on California) but less intensely than Republicans.
The Democrat–Republican split on California's direction is one of the widest gaps in the entire poll.
Billionaire Tax: Support Collapses When Voters Learn the Fine Print
A proposed November ballot measure would impose a one-time tax on California billionaires. When asked about the measure without additional context, 50% of LA voters support it, 35% oppose it, and 15% are unsure.
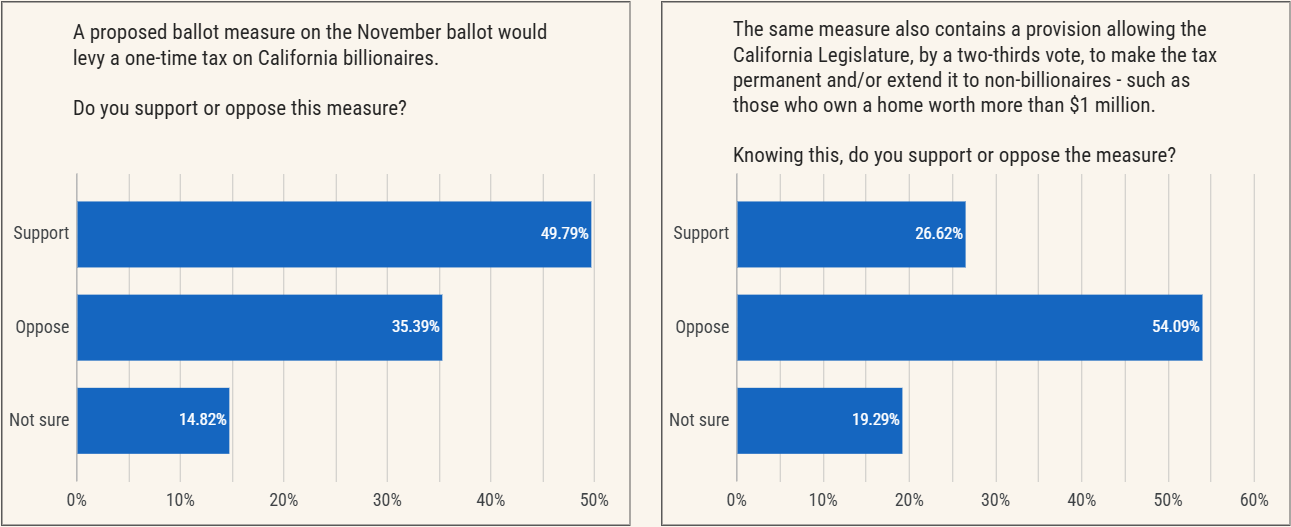
The measure includes a provision that allows the California Legislature, by a two-thirds vote, to make the tax permanent and extend it beyond billionaires, including potentially to people who own a home worth more than $1 million.
Once voters learn about that provision, the picture inverts. Support drops to 27%, opposition climbs to 54%, and unsure grows to 19%. A 15-point support advantage becomes a 27-point opposition advantage. That's a 42-point swing.
Republicans oppose it throughout: 75% without context, 82% with it. Independents start split (43% oppose, 41% support) and shift to clear opposition once informed (63% oppose, 25% support).
Democrats support the measure on its face (63% support, 23% oppose) but flip to opposition once the scope is explained: 44% oppose, 32% support.
The Democratic flip is the most striking result in the poll. A clear majority of Democrats support taxing billionaires in principle. When they learn that the same provision could be extended to homeowning Californians, more oppose than support it.
What this means
Three things stand out.
One: The race for mayor is genuinely competitive among the voters who turn out in November. Three candidates sit within a 4-point window. Anyone telling you they know who wins is guessing.
Two: The voters who decide which of those candidates make the November ballot are not the voters in this poll. Primary turnout is a fraction of the general turnout. The electorate that shows up in the primary will have an outsized influence over what LA's choices look like in November.
If that electorate skews older, more partisan, or more Democratic than the general electorate this poll models, the outcome could look very different from the numbers in this poll.
Three: Voter preferences move when they have more information. The 42-point swing on the billionaire tax is a reminder that polling captures preferences under whatever information voters have at the moment they answer. As campaigns and ballot pamphlets fill in details, those preferences can shift substantially.
The primary is the next decision point. Show up.
Methodology and Reliability
The IVP 2026 LA City Poll was conducted May 7–11, 2026, among 806 screened and verified registered Los Angeles city voters.
The sample was drawn directly from L2's California voter file. All respondents were verified registered voters matched back to that file. Eligibility was restricted to LA city voters who participated in at least two of the last four general elections.
This documented participation threshold served as the turnout model for the survey, anchored in verified voting history rather than self-reported voting intent.
Respondents were reached via MMS outreach using verified cell phone records matched to the voter file. All responses were validated against the source file. Duplicate submissions and unmatched records were excluded prior to analysis.
After applying the high-propensity screen, the dataset was weighted by age, gender, race, and party registration to approximate the demographic composition of LA city voters who turned out in the 2022 general election. The modeled electorate consists of 64.7% Democrats, 16.1% Republicans, and 19.2% independent voters.
The unweighted sample composition is Democrats n=545, Republicans n=162, and independent registrants n=99.
For purposes of this survey, IVP defines independent voters to include all voters not registered as Democrats or Republicans, including No Party Preference registrants, American Independent Party voters, and all other minor party registrants. American Independent Party registrants are treated as independent for all analytical purposes, consistent with California's nonpartisan primary structure.
In practical terms, this turnout model represents LA city's general-election electorate, not its primary electorate. Primary turnout in Los Angeles is meaningfully smaller, older, and more partisan than the general electorate this poll is modeled on. A material change in turnout composition between the primary and the general, particularly among independent and younger voters, would alter projected ballot dynamics.
The overall margin of error is ±3.9 percentage points at the 95% confidence level, adjusted for the design effect introduced by weighting using Kish's effective sample size of 623. Subgroup margins of error are wider: ±4.7 points for Democrats, ±8.8 points for Republicans, and ±10.8 points for independent voters.
As with all voter-file-based online samples, the margin of error reflects sampling precision within the modeled electorate and should be interpreted as an estimate rather than a guarantee of representativeness.
The survey instrument covered the LA Mayor's race (first and second choice), the California Governor's race (first and second choice), party trust, LA City direction, California direction, the proposed billionaire-tax ballot measure (with and without context on its scope), and intent to vote in the 2026 primary.
All results reported reflect weighted percentages unless otherwise noted.
This poll should be understood as a structural model of LA city's general-election electorate. It is not a forecast of primary outcomes, and material changes in the composition of the turnout would alter the topline results.