Monopoly Politics: Only 5% of House Seats Up for Grabs in 2018

 Rob Richie
As we do each election cycle, FairVote has projected the partisan results of the next elections to the U.S. House of Representatives, and the results show a shocking lack of competition or fair representation. Since our first edition in 1997, we have called this biennial report Monopoly Politics - with good reason.
Take a look at Monopoly Politics 2018, a fascinating companion report simulating the Fair Representation Act in all 50 states, and our interactive spreadsheet tool.
FairVote’s methodology projects with high confidence only the very safest seats. With 435 seats elected every cycle, you might think that means 50 or 60 incumbents. Think again. This year we are projecting 374 seats with high confidence - that’s nearly 86% of House seats. Almost every incumbent seeking re-election can feel very confident about victory in November 2018, no matter who their opponent is, how much is spent, or what kind of partisan wave there might be.
To underscore our level of confidence, we made similar projections going into 2012, 2014 and 2016 in a total of 1,062 House races. We missed only one seat - that means our high confidence projections have an accuracy rate of more than 99.9%.
The 2018 report shows the most ossified electoral landscape yet, being the first year we have projected more than 370 seats at this degree of confidence. The following map shows each congressional seat as an equal area. Only the yellow seats are in play; the purple seats are all safe enough to be projected with high confidence.
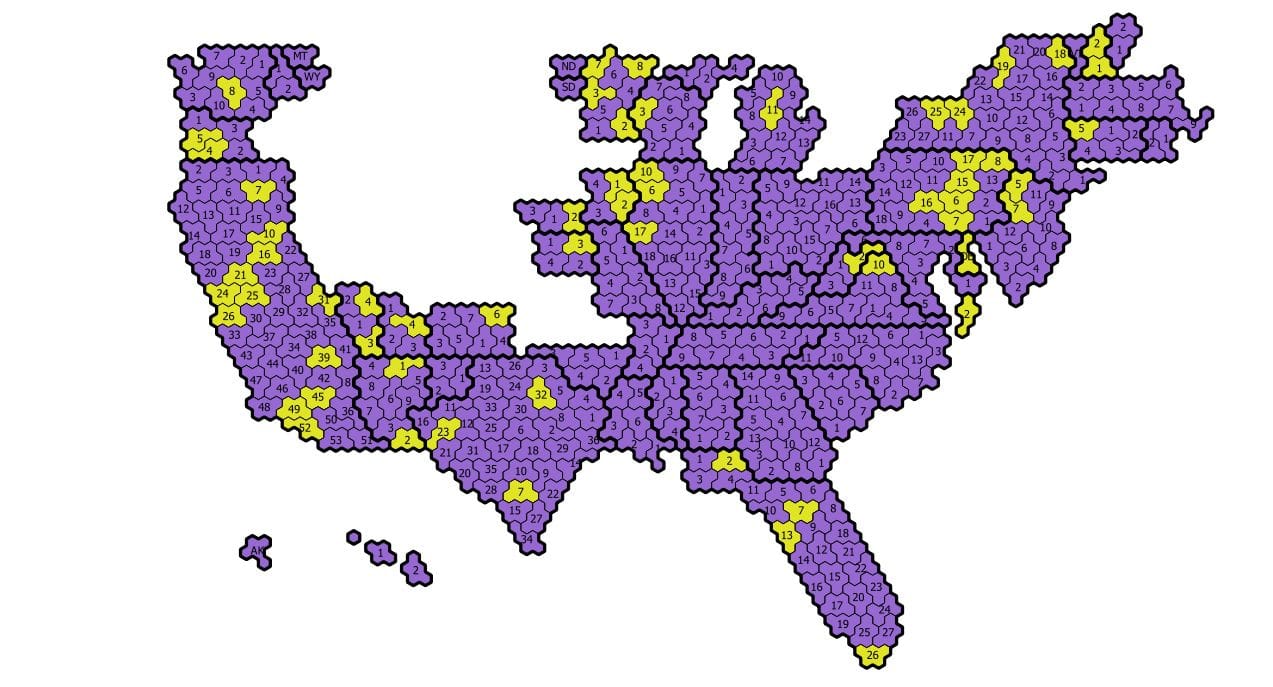
In addition to our 374 high-confidence projections, we also project favorites for the other 61 seats, though at a lower level of confidence. There are an additional 40 seats that clearly favor one party over the other, but not enough to warrant a projection. That leaves only 21 (approximately 5%) true “toss up” seats that only very slightly lean to one party.
When we projected all 435 seats in 2016, we were remarkably accurate, even in the lower confidence projections. Of the 56 seats we did not project, but which favored one of the parties, we were right in 50 (89.3% correct). Of the 18 seats that were true “toss ups” with only a very slight lean toward one of the parties, we were right in 12 (66.7% correct). That means our full projections were correct in 423 out of 435 districts (97.2% correct). Those projections were made more than two years before the 2016 elections.
What makes this all the more disturbing is that our remarkable accuracy ignores all polls, all demographic characteristics of the districts, and ignores the incumbent’s voting record and any scandals. We use only the presidential election results (both in the district and nationally) from 2016, and the incumbent’s performance in prior elections.
The only updates we make after we have that data is to remove incumbents when they announce that they will not seek re-election and to recalculate our projections if a state redraws its district lines. We explain our methodology in the report in detail, but the overwhelmingly important factor is a district’s partisanship, measured only by the relative presidential vote in that district.

To make our projections transparent and accessible, FairVote also produces an interactive spreadsheet in which you can see each projection and how it was made, as well as data on all 435 seats. A separate tab on this sheet provides the national and state-by-state statistics, showing partisan skews with blue and red, as well as levels of competition in purple, with the safest states in a highly visible bright orange.
We invite you to visit the site, see our projections and make your own by putting in the two pieces of information we can’t predict: the national two-party preference and the electorate’s general view of incumbents.
Want more information and in-depth analysis? Continue reading here.
Editor's note: This article was co-written by Rob Richie and Drew Penrose. It originally published on FairVote's blog and has been modified slightly for publication on IVN.
Photo Credit: Drop of Light / shutterstock.com
You Might Also Like


