 Ethan Handelman
There is a familiar rhythm to early statewide campaigning in California.
A new poll drops. A candidate is declared “on top.” Donors recalibrate. Consultants ponder consolidation scenarios. Political pundits and the chattering class try to narrow the field before most voters even know who the candidates are.
That dynamic is unfolding now.
A February Emerson College Polling survey showing Republican Steve Hilton leading the nonpartisan primary field has helped shape the early narrative. That poll, conducted using a traditional likely voter model, captures early positioning and partisan alignment.
But topline “horse race” numbers alone do not reveal the structure or potential pathways to victory.
The IVP 2026 California Governor Benchmark Poll was designed to go deeper.
Our IVP interactive data dashboard is embedded below.
Using verified California voter file data, IVP surveyed high-propensity voters from February 13 through 20. The poll tested first-choice ballot preferences alongside issue intensity on affordability and the cost of living, immigration enforcement and ICE cooperation, corruption perception, voter ID requirements, Top Four ranked choice voting (aka “More Choice”), the four-day work week, and party trust.
It assumes a typical, off-year gubernatorial primary turnout. The party organizations and unions will likely run robust turnout operations to boost base partisan turnout.
To move beyond surface numbers, IVP conducted multivariate regression analysis using multiple independent modeling systems. Each model was run separately and cross-validated to identify consistent predictive variables while minimizing model-specific distortion.
The results of both the Emerson Poll and the IVP Poll were then reviewed by five experienced political consultants, none of whom were currently working for any candidate. We assessed where the surveys aligned, where turnout assumptions diverged, and what the structural math suggests about viable pathways for candidates to win in June.
This is not a forecast. It is a structural assessment of the race at a specific point in time. By any criterion, the race remains wide open.
Two Polls, Two Turnout Universes
The Emerson poll captures a broader likely voter universe and shows Hilton leading in a crowded field.
The IVP Benchmark Poll models a high-propensity electorate anchored in documented recent turnout behavior.
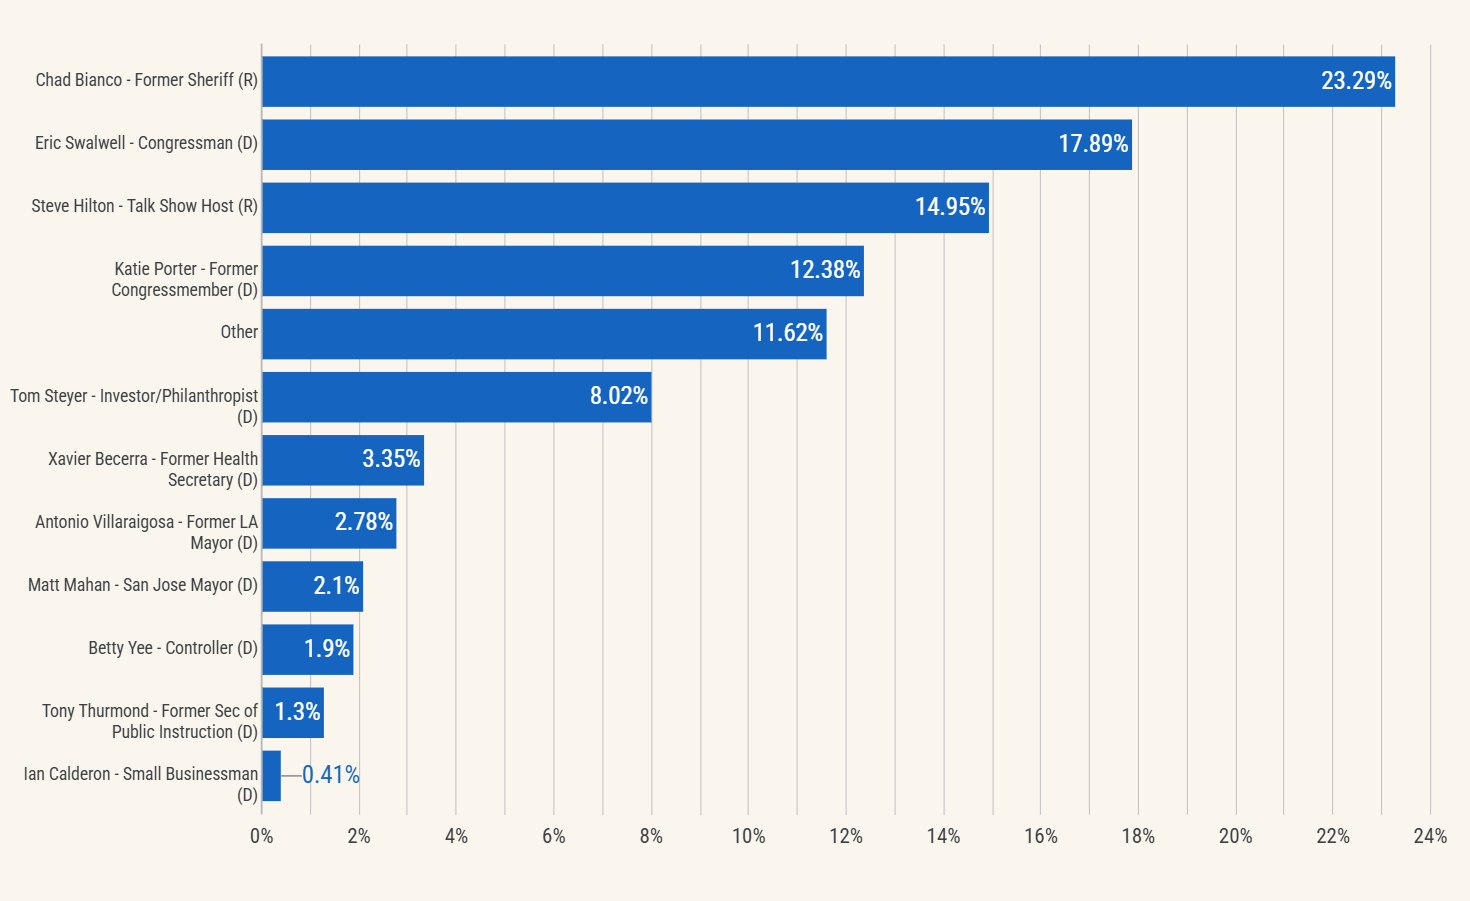
Under that model, Chad Bianco leads the field, followed by Eric Swalwell, Steve Hilton, and a cluster of Democratic candidates.
Turnout modeling matters in a fragmented, nonpartisan Top Two primary. Small shifts in electorate composition materially change who occupies second place.
Distrust
On multiple issues, even where voters have a broad consensus, political outcomes remain uncertain.
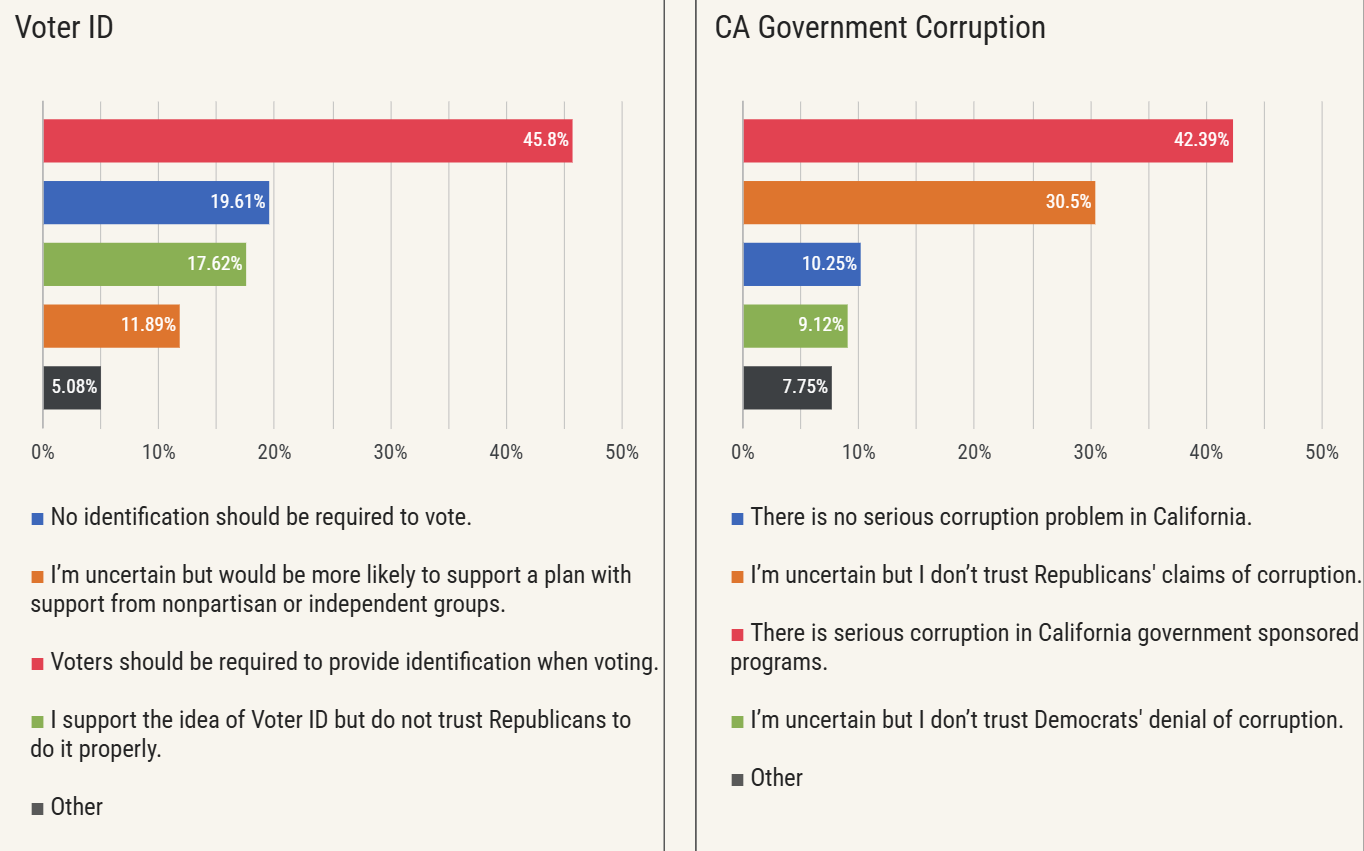
For example, on Voter ID, despite overwhelming support, a substantial number of Voter ID supporters distrust Republicans as messengers. The same could be said in reverse for other issues.
The California electorate is really better described as voters who distrust Democrats, voters who distrust Republicans, and voters who distrust both.
Support for structural electoral reform is strongest among voters who also express distrust in both parties. These voters are not ideologically uniform, but they share institutional skepticism and frustration with binary partisan politics.
When asked “if you had to choose which party you trust more,” nearly 40 percent of No Party Preference voters refused to select either party.
In a Top Two nonpartisan primary, that bloc is decisive.
Growing Republican Traction Amongst NPPs
Among No Party Preference voters, Chad Bianco receives 26.8 percent — the single largest share in that bloc. Historically, California NPPs have leaned heavily democratic.
In this poll, independents appear not to be simply waiting to consolidate behind a Democrat. A significant portion is currently aligning with a Republican candidate associated with enforcement and institutional dissatisfaction.
The same First Choice by Party Registration table reveals another structural reality. Tom Steyer, Eric Swalwell, and Katie Porter combined draw only 2.6 percent of Republican voters in the IVP model.
It suggests that, under current conditions, those candidates have virtually no measurable crossover penetration within the Republican electorate. Their path to June depends almost entirely on Democratic turnout and consolidation, plus incremental movement in a subset of No Party Preference voters.
These candidates, along with other Democrats, are competing in the same voter pool.
This inability to appeal beyond the Democratic base is what makes it possible for two Republicans to win in June.
Pathways to June: What Each Candidate Must Do to Advance to the Top Two
Chad Bianco
Bianco currently leads under the IVP high-propensity turnout model. His support is anchored in strong enforcement views, distrust of Sacramento institutions, and reliable Republican primary participation, particularly in Riverside County, the Inland Empire, and parts of the Central Valley.
His pathway to June is consolidation within the Republican lane. If he becomes the clear enforcement and anti-Sacramento candidate, he locks in a stable mid-20s base that is difficult to dislodge in a fragmented field. To strengthen his position, he must also broaden his affordability message to suburban voters who are economically frustrated but not deeply ideological. If Republican voters remain split between him and Hilton, his margin tightens. If they consolidate, he becomes one of the most structurally secure candidates in the field.
Vulnerability: Controversial history as a Southern California sheriff.
Steve Hilton
Hilton’s coalition supports full cooperation with ICE, has serious concerns about corruption, and has high levels of trust in the Republican Party. He shows strength in Orange County and suburban coastal regions.
His path requires overtaking Bianco as the dominant Republican alternative. Without that shift, vote splitting limits his ceiling. If he reframes himself as the most credible cost-of-living candidate rather than purely a partisan Republican alternative, his June pathway strengthens considerably.
Vulnerability: Difficult to expand. His media presence gives him high name recognition with a very narrow ideological spectrum of voters.
Eric Swalwell
Swalwell’s base is highly engaged Democrats, particularly in the Bay Area and urban Los Angeles. His support correlates strongly with partisan loyalty and opposition to expanded ICE cooperation.
His pathway depends on mobilization and Democratic consolidation. If Democratic voters narrow the field early and align behind him, he is well-positioned to secure a top-two slot. However, his numbers soften among No Party Preference voters in suburban regions where affordability dominates. To expand, he would need to pivot more aggressively toward state-level economic governance rather than national partisan framing. His ceiling rises as Democratic fragmentation declines.
Vulnerability: He has a well-established national brand, but like Hilton, it is anchored to a very narrow ideological base.
Katie Porter
Porter’s coalition is most clearly aligned with skepticism of corporate influence. She performs competitively in suburban coastal districts, including Orange County, where housing costs and economic anxiety drive voter behavior.
Her pathway to June runs through increasing turnout among women. If the race centers on the cost of living, she becomes the Democratic candidate most closely associated with tackling affordability, and she can also consolidate support among suburban Democrats and some independents.
Vulnerability: Highly publicized claims about temperament and lack of political experience in California.
Antonio Villaraigosa
Villaraigosa is strongest amongst Latino voters. He performs best in Los Angeles County and with moderate Democrats focused on economic mobility.
His pathway requires maximizing Southern California turnout while preventing vote erosion to other Democratic candidates. If he dominates Los Angeles and performs well among moderate voters concerned about affordability, he can remain viable even without a strong showing in Northern California.
Vulnerability: Four Latino candidates remain in the race, including Republican Bianco, who currently leads among Latino voters.
Xavier Becerra
Becerra’s support is rooted in institutional familiarity and long-standing Democratic loyalty. He performs strongest among older Democrats and voters who prioritize experience and administrative continuity.
His pathway only improves as the field narrows. If voters shift toward perceived electability and governance competence late in the cycle, his coalition strengthens. However, absent increased enthusiasm or sharper differentiation on affordability, his early positioning trails the leading Democrats.
Vulnerability: There is a current U.S. Attorney investigation involving a former Becerra staffer, lending to uncertainty with donors who may otherwise have consolidated behind his candidacy.
Betty Yee
Yee performs well among fiscally focused Democrats, particularly in the Bay Area and Sacramento region. Her support correlates with voters who prioritize administrative competence and government oversight.
She enjoys strong support among active Democrats, having just finished third at the California Democratic convention.
Her pathway depends on increasing statewide visibility and tying her fiscal stewardship credentials directly to the affordability crisis. If she successfully frames the cost of living as a management failure requiring disciplined oversight, she could expand beyond policy-engaged voters.
Vulnerability: Despite her position as a statewide officer, she has not demonstrated the ability to raise funds competitively with others in the race.
Tom Steyer
Steyer has reportedly spent more than $30 million on advertising so far. In most cycles, that level of spending would generate durable double-digit positioning not yet reflected in any polling.
Despite high awareness, Steyer lacks a dominant issue alignment cluster in the regression analysis. He performs well among voters supportive of abolishing ICE and voters with a high level of trust in the Democratic Party.
Vulnerability: Likely resurfaced claims made during his failed presidential campaign regarding his finances, conflicts of interest, and involvement in funding “failed” California policies.
Matt Mahan
Mahan’s support is structurally distinct. He overperforms among No Party Preference voters, voters who distrust both major parties, and those who believe corruption exists in state programs. He also benefits from above-average support among voters who favor More Choice voting and broader electoral reform.
In the IVP Poll, 38.3 percent of Mahan’s supporters trust neither major party — the highest of any candidate in the field — suggesting his coalition is uniquely positioned to attract voters who would otherwise consider an outsider candidate regardless of party.
Both polls show nearly 8 to 9 percent of Democratic voters casting first-choice ballots for a Republican candidate. Mahan and Yee appear to be the only Democratic candidates with the potential to meaningfully stem that leakage.
Vulnerability: With no room for an additional Democrat splitting core Democratic voters, Mahan faces the more complicated challenge of cobbling together a coalition of Democrats, NPPs, and a sliver of Republicans.
Methodology and Reliability
The IVP 2026 California Governor Benchmark Poll was conducted February 13–20, 2026, among 868 screened and verified registered California voters.
The sample was drawn directly from L2's California voter file. All respondents were verified registered voters matched back to that file. Eligibility was restricted to voters who participated in at least three of the last four major statewide elections: the June 2022 primary, November 2022 general, March 2024 primary, and November 2024 general, with a minimum of one primary and one general among those elections. This documented participation threshold served as the turnout model for the survey.
Respondents were reached through two channels: SMS outreach to verified cell phone records matched to the voter file, and Meta placements targeted exclusively to voter file-matched audiences. All responses were validated against the source file by name, address, and email hash. Duplicate submissions, timestamp anomalies, and unmatched records were excluded prior to analysis.
Unlike generic "likely voter" screens that rely primarily on self-reported voting intent, this model is anchored in verified voting history. It reflects a habitual primary electorate rather than the broader population of registered voters or occasional participants.
After applying the high-propensity screen, the dataset was weighted by party registration, age, gender, and race to approximate expected statewide primary turnout demographics. The modeled electorate consists of 47.7 percent Democrats, 30.2 percent Republicans, and 22.1 percent independent voters. The unweighted sample composition is Democrats n=297, Republicans n=322, and independent registrants n=249.
For purposes of this survey, IVP defines independent voters to include all voters not registered as Democrats or Republicans, including No Party Preference registrants, American Independent Party voters, and all other minor party registrants. American Independent Party registrants are treated as independent for all analytical purposes, consistent with California's nonpartisan primary structure.
In practical terms, this turnout model represents California's consistent primary electorate and does not assume a surge among lower-propensity or newly registered voters. A material change in the composition of turnout, particularly among independent voters, would alter projected ballot dynamics.
The overall margin of error is ±3.6 percentage points at the 95 percent confidence level, adjusted for the design effect introduced by weighting using Kish's effective sample size of 739. Subgroup margins of error are wider: ±6.0 points for Democrats, ±5.6 points for Republicans, and ±6.5 points for independent voters.
As with all voter-file-based online samples, the margin of error reflects sampling precision within the modeled electorate and should be interpreted as an estimate rather than a guarantee of representativeness.
The survey instrument covered the Governor's race (first and second choice), government corruption, immigration enforcement, voter identification requirements, ranked-choice voting, the four-day workweek, and party trust. All results reported reflect weighted percentages unless otherwise noted.
This poll should be understood as a structural model of high-propensity June primary voters. It is not a forecast, and material changes in turnout composition would alter the topline results.