Despite What You've Heard, 2016 Was Not a Historic Year in Primary Turnout
 Marisa Gomez
This year’s presidential primaries began with a flurry of unconventional occurrences. A double-digit candidate count for the Republican Party, a political revolution, and daily Twitter attacks brought the 2016 primaries into an unprecedented spotlight. This led many to predict historic highs in voter turnout.
With almost all 50 states publishing their voter turnout statistics, the sad truth reveals that the 2016 primaries will not break turnout records in the U.S.
Based on available data, turnout nationwide was just under 29% of the eligible voting population, compared to 30.4% in 2008. California, which held its primary elections on June 7, has yet to officially release its final turnout numbers as the state just completed counting ballots.
This year, voter turnout ranged from a low of 19.92% in Texas to a high of 56.27% in New Hampshire. As the chart illustrates above, high turnouts tend to be much more frequent in the early contests while the frequency of low turnout contests increases the further we get into primary season.
States that voted in February, the first month of presidential primaries, had an average voter turnout among registered voters of 46.96% (granted there were only two primaries in that month). Average turnout in March, however, dropped dramatically among registered voters, decreasing nearly 10 percentage points to 37.99%.
The 7 states that voted in April produced a 33.59% average voter turnout while May stayed relatively steady at a 33.90% average. June, the final month of the primaries, drew an average of just 29.65% of registered voters to the polls.
So, what do all of these numbers mean and why the huge drop from the beginning of the primary season to the end?
In modern U.S. presidential elections, the first few states to vote are given preferential treatment by both the candidates and the media. They set the tone for the primaries and voters feel the nation’s eyes on them, meaning that social pressure to vote is also a considerable factor.
By the time the final states open the polls, the nation’s choice for nominees is relatively clear and voters feel that their ballots have less of an impact. As a result, the boil of urgency and excitement that filled the air during the first month of primaries calms to a simmer in the final stretch.

However, 2016 was a unique year. Neither party's nominations were decided until near the end of the primary season, meaning media attention remained high and candidates had to continue to compete in every state for every vote they could. Yet, turnout in 2016 followed the same historical trend as previous elections, when presumptive nominees were often crowned after the first Super Tuesday in March.
The downward trend in turnout may be indicative of something else entirely that goes beyond primary scheduling and lines at polling locations: many people have become disenchanted with the election process completely or are encumbered by the system itself. After all, while several media pundits and political talking heads tout 30 percent turnout as "high," that means 7 in 10 eligible voters did not participate at all.
While over 40% of voters self-identify as independent, the current primary process serves to nominate candidates who represent two groups that are now in the political minority — the Republican and Democratic parties. Yet, a majority of Americans say neither of these two private political organizations represent America's interests anymore.
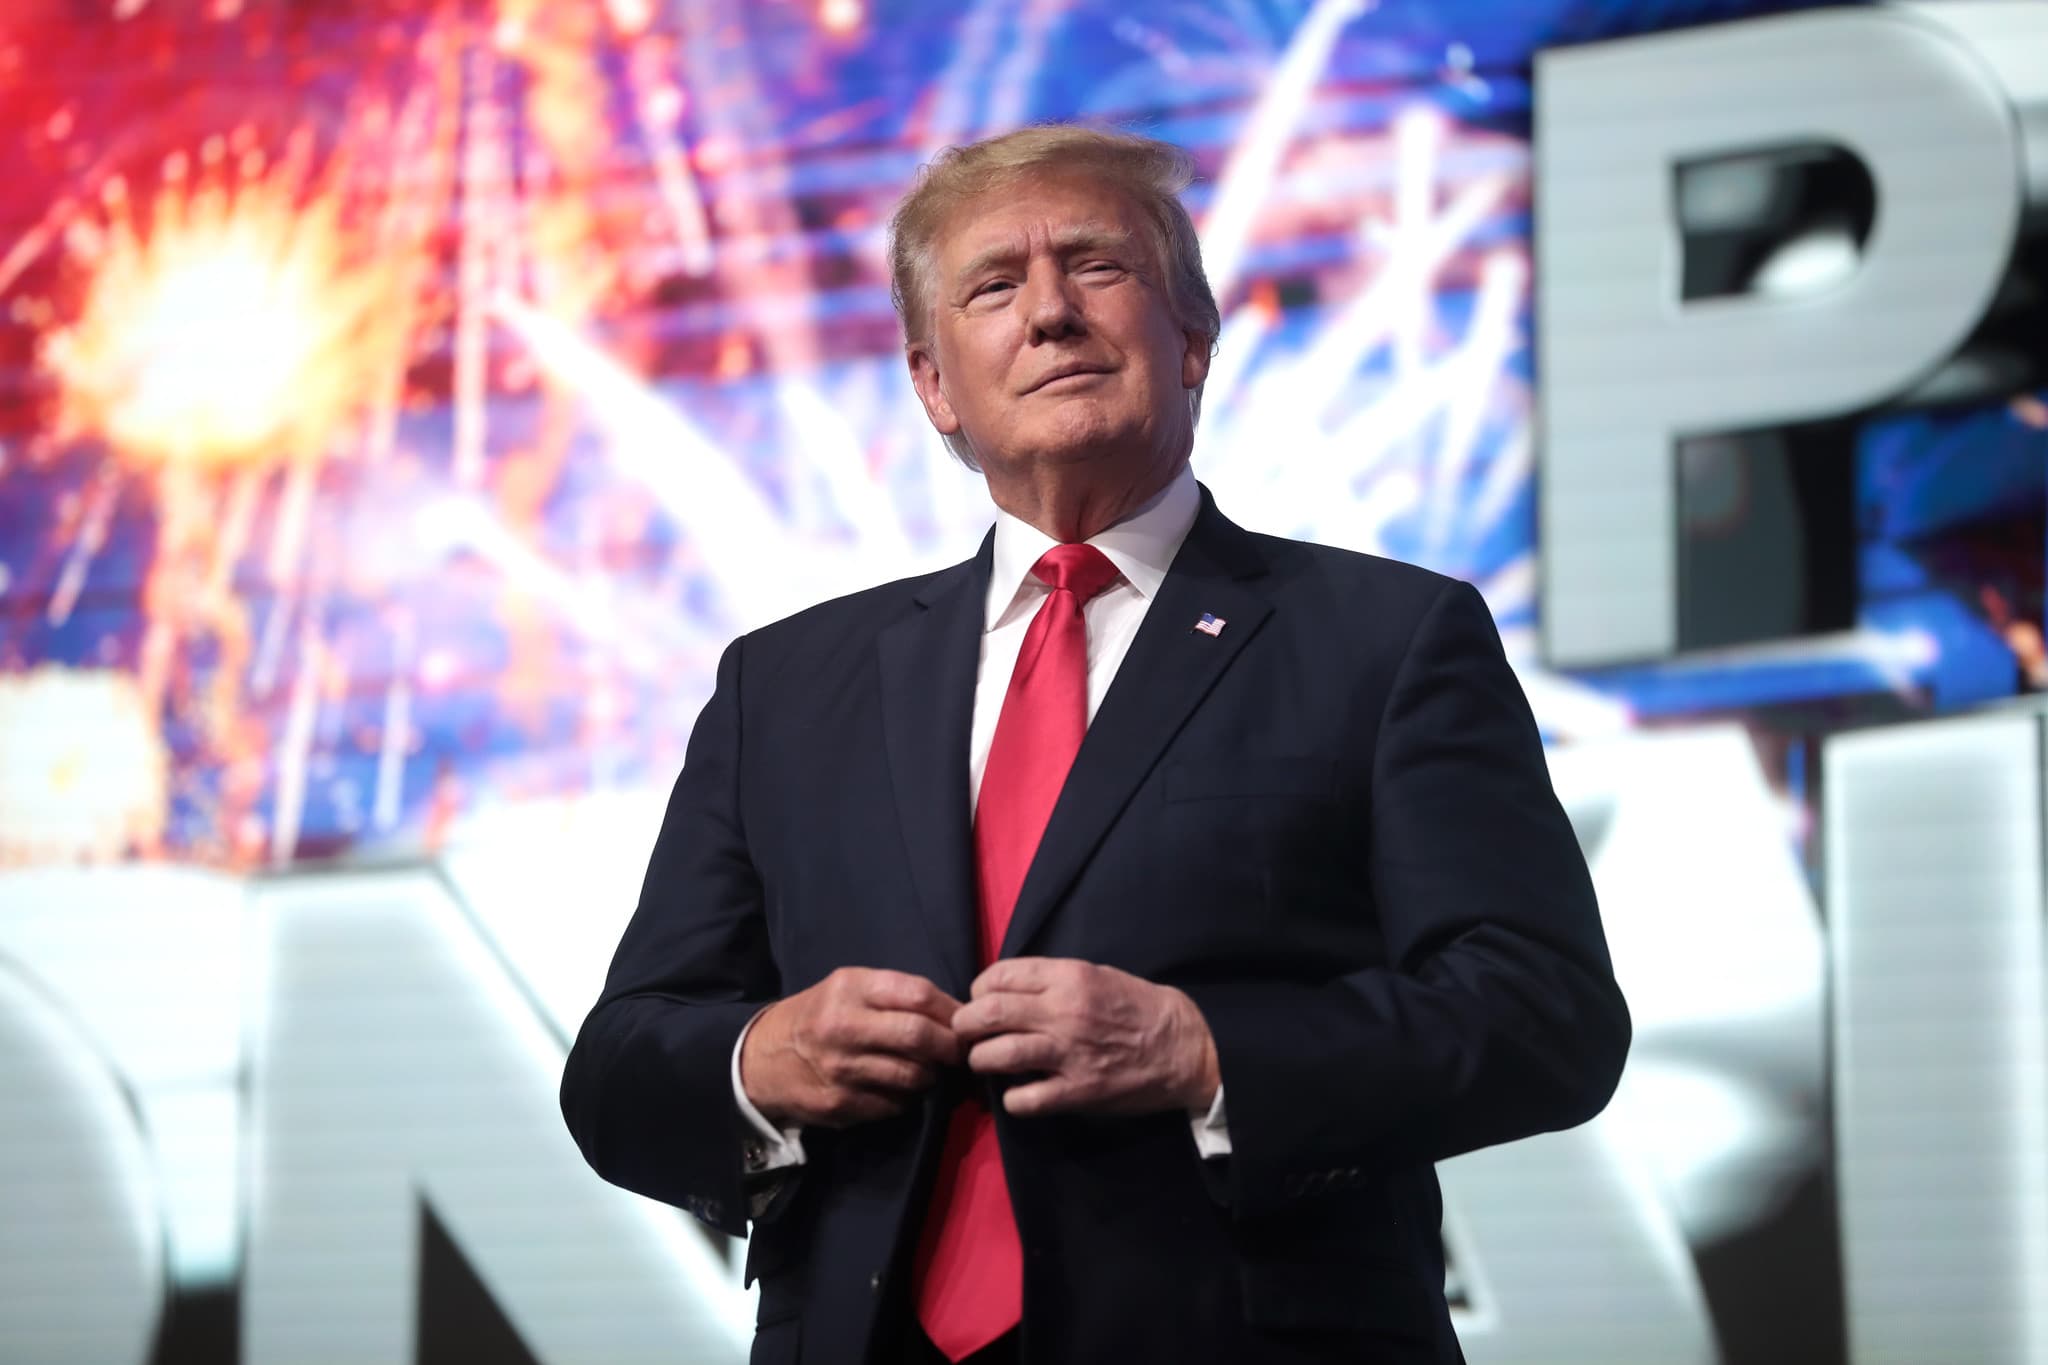
Now, two presumptive presidential nominees are set to strut across the stage at their respective party conventions with the highest disapproval ratings in history, and yet voters are often led to believe that these are the only real options they have. As one might expect, surveys and polls show that this has resulted in a general feeling of hopelessness and uncertainty among voters.
You Might Also Like