Much has been made of the cost of New Jersey’s special senatorial election this past year, which saw Cory Booker elected to replace Frank Lautenberg as the Garden State's second representative to the Senate.
Montclair Deputy Mayor Bob Russo was just one politician among many from both the Democratic and Republican parties to call the elections a “complete waste of taxpayer money."
In Chris Christie’s attempt to keep a galvanized Democratic base away from his own re-election bid, he scheduled a primary election in August and the actual election in October, a mere three weeks before the gubernatorial election day. The cost to voters of the state equaled almost $24 million; $12 million for the primary election and $12 million for the general.
The National Journal found that the costs break down as follows:
- $5.4 million: The approximate cost for poll workers' salaries per election. This number is based on the 6,542 polling places in 2013, the minimum number of workers per polling place (four), and the $200 salary for poll workers. The cost would be divided between the counties and the state.
- $6.5 million: The approximate cost for "ballot printing and postage, processing, legal advertising, polling-place rental, and voting-machine delivery" per special election.
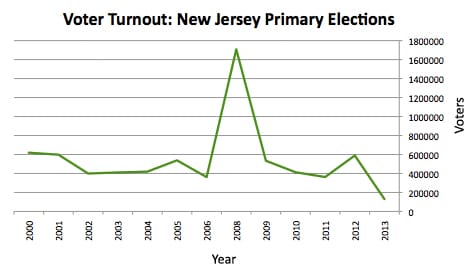
In addition to the astronomical cost in the midst of budgetary struggles, the voter turnout was one of the lowest in history.
In the 2013 primary election for example, there was only a 9 percent voter turnout of eligible voters -- 130,340 voters. The cost, therefore, per participant in the primaries alone was over $92.
Presidential election years typically see upwards of half a million voters cast their ballots in primaries. House and Senate campaigns reach anywhere between 300,000 – 400,000 voters on average during mid-term elections, making the cost up to $50 per participant over the past 15 years.
This year's special election was therefore not only one of the lowest in terms of citizen participation, but also one of the highest in terms of expense.
Editor's Note: State offices in New Jersey were contacted about the cost of elections and a Freedom of Information Act request was filed. The state was not able to provide specific data on the cost of past elections. The spending figures for past elections are an estimate based on 2013 data.
Photo Credit: spirit of America / shutterstock.com