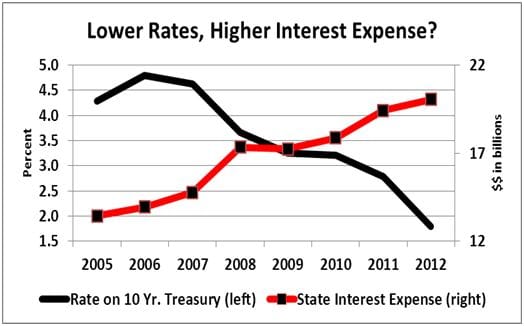
State interest expenses have risen even as interest rates have fallen.
It’s general knowledge that falling interest rates help debtors. As long as a loan can be refinanced at a new, lower rate, a debtor can expect lower payments.
Then what’s going on with the fifty states?
Interest rates have been falling significantly since 2007, but the cumulative interest expense of the states has been steadily marching higher anyway.
From fiscal 2005 to 2012, total interest expense reported by the 50 state governments more than doubled, even as the 10-year Treasury rate fell by two-thirds. (Note: we estimated New Mexico interest expense for its June 2012 fiscal year. As of August 2, 2013, New Mexico still hasn’t reported its 2012 results.)
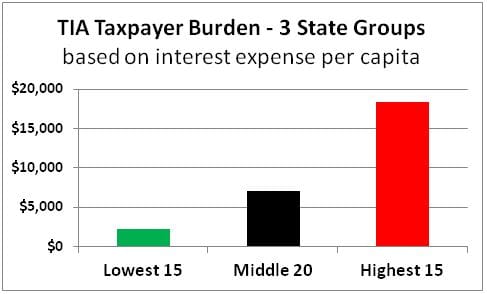
The fifty states are far from equal on this matter, however. One way to compare the states is to examine their interest expense per capita. After investigation, it soon becomes apparent that the “rising interest expense amidst falling interest rates” story is concentrated in states with higher interest expense per capita. Those states also tend to carry higher Taxpayer Burdens, as estimated by Truth in Accounting.
The chart below shows the average TIA Taxpayer Burden for three different groups of states, which are grouped by the average interest expense per capita from 2005 to 2012. States with higher interest expense also have higher Taxpayer Burdens. The states with the highest interest expense per capita also have poor fiscal health.
Many states have apparently not been able to benefit of low interest payments, as debt levels have increased and the spreads for rates paid by challenged states have widened over base rates. While some states have established hedges in derivative instruments, this still highlights the risk of a possible further spike in interest expenses if rates bounce back up.
Moreover, this danger lurks primarily in the states with unhealthy fiscal positions—the last states to need any more financial difficulties heaped on them.
Where does your state stack up in this picture? You can quickly find this information and more using State Data Lab.