Map of California Energy Production: Gas Will Remain Top Producer


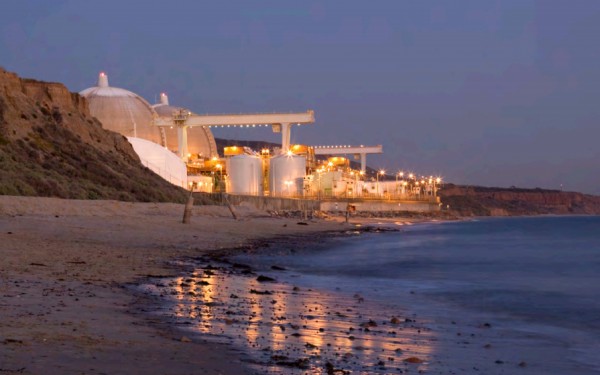
One of the biggest issues in California this summer is the availability of energy and its affordability. Southern California will lose out on about 2,200 megawatts, or the power for 1.4 million homes, because of the closing of the San Onofre nuclear power plant.
Southern California already went one summer without power from San Onofre, so what makes 2013 different? Backup plans from Summer 2012 are no longer available, a California Energy Commission report confirms:
Several options implemented for summer 2012 cannot be continued in 2013 and 2014, in particular using Huntington Beach Units 3 and 4 to generate power. These units were no longer able to generate power as of October 31, 2012, under the terms of the air permit allowing the new 500 MW Walnut Creek facility in the City of Industry to begin operating in June 2013.
The California Independent Systems Operator (CAISO) says an extra 2,500 megawatts (MW) will be brought in for the summer. However, CAISO also said the "majority of this new capacity has been gas-fired power plants. Solar and wind have contributed to the added capacity, but to a much smaller degree." Additionally, reliability issues presented by San Onofre won't come into play.
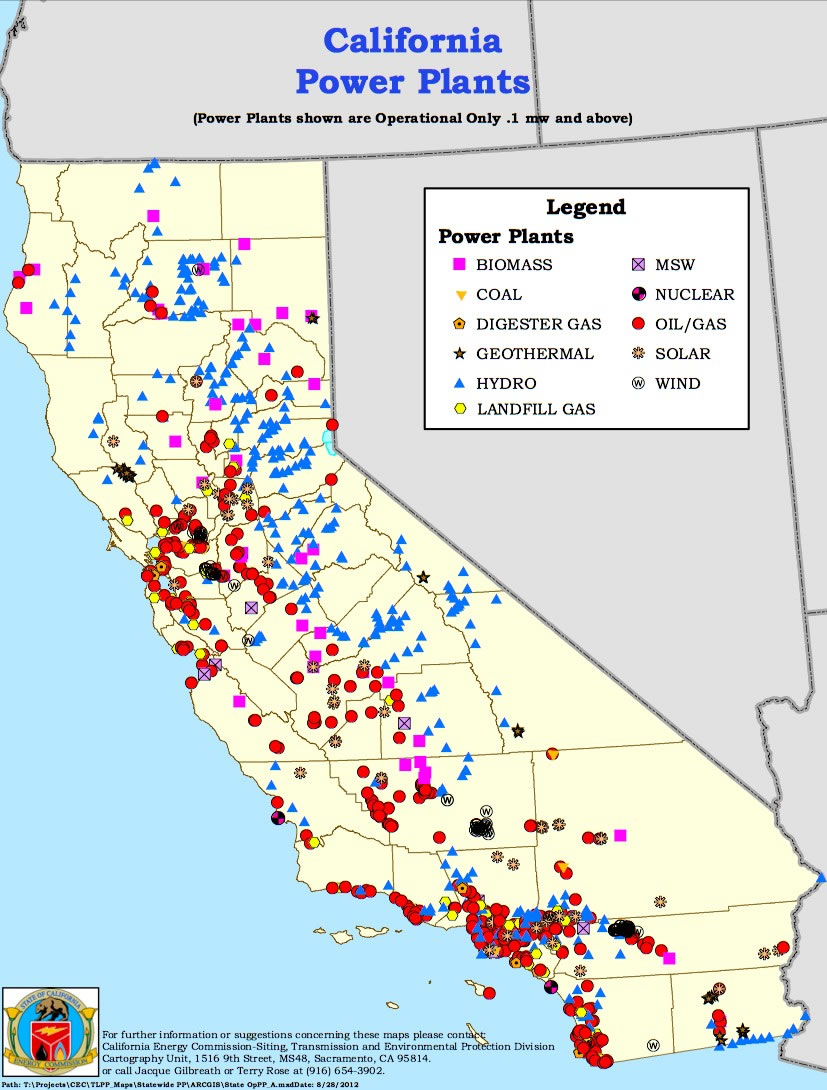
So, where else do Californians get their energy if not from a nuclear power plant? Below is a map of every energy source in California, last updated by the Energy Commission in August 2012:
Credit: California Energy Commission (click to enlarge)Most recent data available from the U.S. Energy Information Administration, natural gas made up most of California's energy production. In the summer of 2010, it accounted for 41,370 MW of power. Coal and petroleum only accounted for 1,075 MW.
The presence of hydroelectric is prominent along the eastern side of California and accounted for 10,141 MW. Investment in renewable energy will always be emphasized in the energy debate. When aggregating the production of solar, wind, biomass, and geothermal energy, summer 2010 output was at 6,319 MW.
The energy map shows both San Onofre and Diablo Canyon nuclear power plants on the coasts of San Diego County and San Luis Obispo, respectively. During the same time period, the two plants produced 4,390 MW.
All California energy production combined created 64,911 MW of energy. Net peak demand was at 62,564 MW.
Campaigns on urging consumers to conserve energy this summer have already started in Southern California. Rate structures are also being debated in the state's Legislature with Assembly Bill 327, which urges the balance of energy prices across the consumer base. Energy will be the most talked about issue in the state over the next few months.


