Obama vs. Paul Ryan Budget Plan: Interactive Graph

Published: 13 Aug, 2012
1 min read
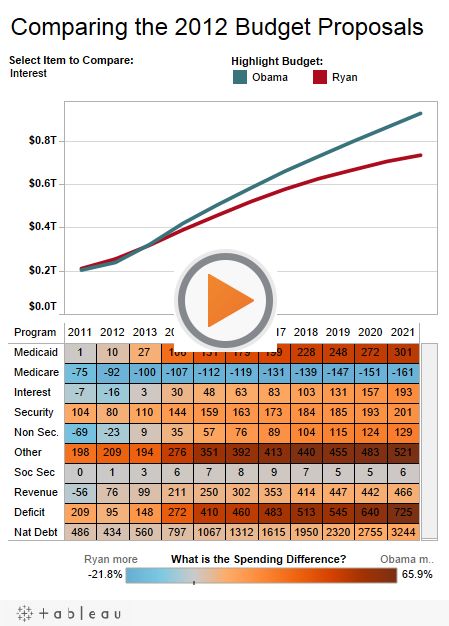
The following interactive graph for comparing the Paul Ryan and Barack Obama budget proposals is pretty nifty. Here's how to read it:
Select from the dropdown box for a list of items you can chart. You can also hover over any of the orange or blue boxes for a popup display comparing the budgetary difference between the Obama and Ryan proposals for that year, for that item. Boxes in blue are years in which Paul Ryan has budgeted more for an item than President Obama. Boxes in Orange are the reverse. Straight Up Comparison Numbers for President Obama come from Whitehouse Budget Summary Tables page 174 (PDF page 6). Numbers for Paul Ryan come from Path to Prosperity Table S-3 on PDF page 64. The category items are identical except Ryan has an extra item for Global War on Terror. To equalize, we added Global War on Terror to Security. Without making any judgment to the contrary, let's assume Ryan and Obama can both "deliver". Here are a few charts depicting the results.
What strikes me is how closely so many of these line graphs trend together. Then note on Medicare, that far from pushing grandma off a cliff, the graph looks like Ryan is pushing her uphill. His plan spends even more than Obama's! Just another example of reality and rhetoric not matching up. This is why it's important to look at cold, hard facts like numbers on "boring" graphs instead of just reading bumper stickers and listening to talking heads argue.
Have at it:
Interactive graph by: Tableau Software
Hat tip: Zero Hedge for the good find
You Might Also Like
Is Trump About to Outflank Democrats on Cannabis? Progressives Sound the Alarm
As President Donald Trump signals renewed interest in reclassifying cannabis from a Schedule I drug to Schedule III, a policy goal long championed by liberals and libertarians, the reaction among some partisan progressive advocates is not celebration, but concern....
08 Dec, 2025
-
5 min read
From the Palisades to Simi Valley, Independent Voters Poised to Decide the Fight to Replace Jacqui Irwin
The coastline that defines California’s mythology begins here. From Malibu’s winding cliffs to the leafy streets of Brentwood and Bel Air, through Topanga Canyon and into the valleys of Calabasas, Agoura Hills, and Thousand Oaks, the 42nd Assembly District holds some of the most photographed, most coveted, and most challenged terrain in the state. ...
10 Dec, 2025
-
6 min read
Ranked Choice for Every Voter? New Bill Would Transform Every Congressional Election by 2030
As voters brace for what is expected to be a chaotic and divisive midterm election cycle, U.S. Representatives Jamie Raskin (Md.), Don Beyer (Va.), and U.S. Senator Peter Welch (Vt.) have re-introduced legislation that would require ranked choice voting (RCV) for all congressional primaries and general elections beginning in 2030....
10 Dec, 2025
-
3 min read


