Are iPhone users more likely to vote for Barack Obama? Are Democrats or Republican more likely to splurge on gadgets? With information provided by Protect Your Bubble, the infographic below shows what mobile devices can reveal about political tendencies.
Some key findings:
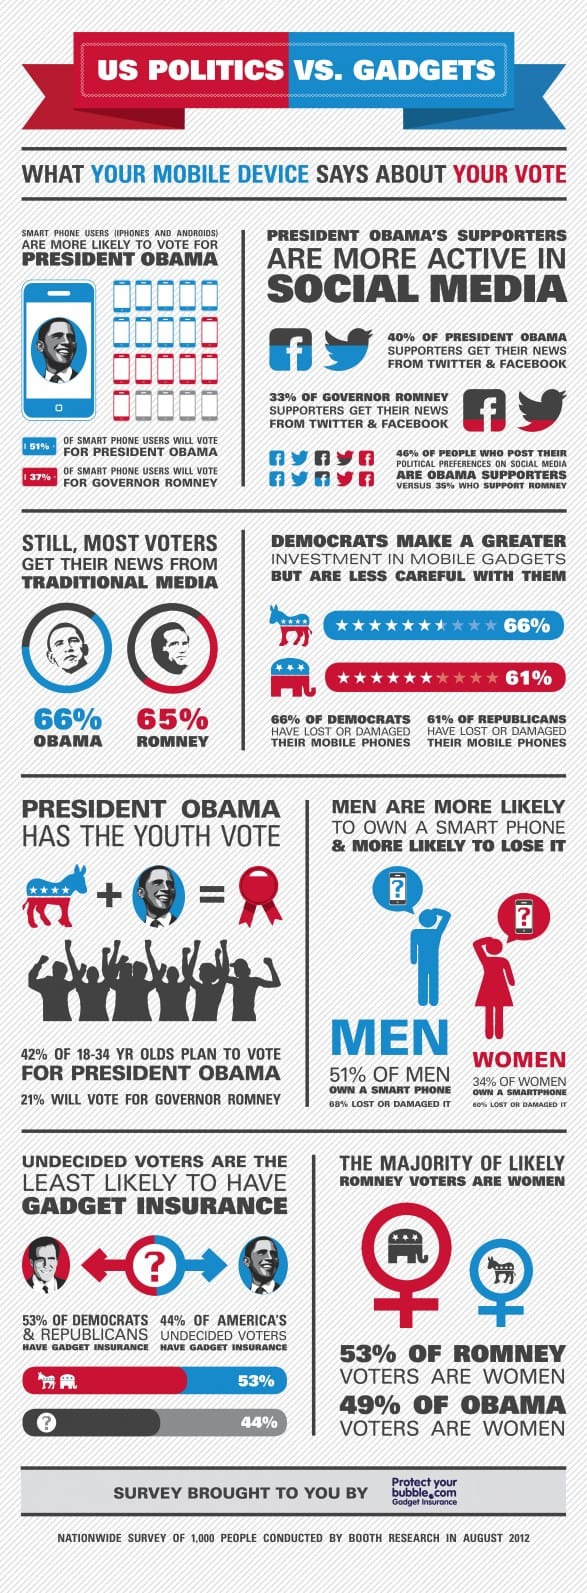
- 40% of Obama suporters get their news from Twitter and Facebook, compared to 33% of Romney supporters who use social media to gather news
- 46% of people who post their political preferences on social media support Barack Obama, suggesting that Obama supporters are more active on social media
- Smart phone users are more likely to vote for President Obama, with 51% of smart phone users supporting Obama
- Men are more likely to own a smart phone, and lose it, with 68% of men losing their smart phones
While it is recognized that Obama succeeds in courting the youth vote, this infographic shows a large gap between youth voters and Mitt Romney. What's more surprising is that amongst the accusations of the Republican-waged "War on Women," the majority of likely Romney voters are women, with 53% of his supporters female versus 49% of Obama voters who are women.
As an independent voter, where do you fit in on this infographic?