The Federal Reserve Bank of St. Louis released the current data for the total debt in the United States Economy on June 5, 2014 -- All Sectors; Credit Market Instruments; Liability, Level (TCMDO). While people, companies, and governments blamed bad weather for a dismal showing in economic activity, it appears they had little trouble finding their way to the banks to add on $471 billion in new debt.
Data from the Federal Reserve Bank of St. Louis (Figures in billions of dollars)Quarter Debt GDP Gap 2013-01-01 $57,406 $16,535 $40,871 2013-04-01 $57,605 $16,661 $40,944 2013-07-01 $58,039 $16,912 $41,126 2013-10-01 $58,914 $17,089 $41,8252014-01-01 $59,398 $16,918* $42,480
*Second estimate lowered initial first quarter GDP estimate of $17,101 to $16,918
Total Debt 2012:Q4 – 2013:Q4 increase of $2,009 billion
GDP 2012:Q4 – 2013:Q4 increase of $660 billion
While the federal debt has been well publicized and heatedly debated, it may not be the most serious threat to the economy. A growing number of economists believe it is our huge total debt, which includes our much larger private debt that is the most dangerous.The Economist reported on a new study of the relationship between private debt growth and recessions by Alan Taylor in its
September 4, 2012 edition. The study looked at debt growth and recessions in 14 major economies between 1870 and 2008.
Mr. Taylor found that rapid growth in private debt was a better predictor of recessions than increases in public debt, growth in money supply, or trade imbalances. Despite this study, there is still great resistance by most current economists to factor in or consider private debt growth in their economic models.
As I have studied the history of debt growth in the U.S. economy, it has become apparent that we have reached a historic point. At no time in human history have so many people been able to borrow so much money so quickly with so little accountability.
In 50 short years, debt has gone from being a luxury for a few to a convenience for many to an addiction for most to a disease for all. It is a virus that has spread to every aspect of our economy, from a consumer using a credit card to buy a $0.75 candy bar in a vending machine to a government borrowing $17 trillion to keep the lights on.
It is this fact that we are in uncharted waters that makes it pretty much impossible for anyone, including Nobel Prize winning economists, to know what will happen next.
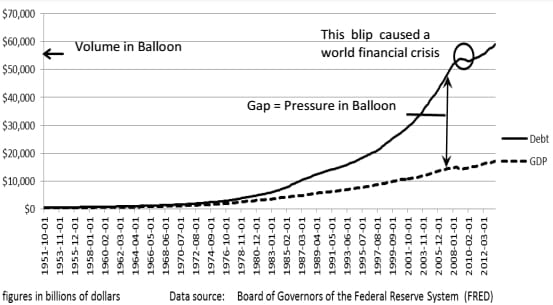
Think of the United States economy as a large balloon. The surface is our economic activity, or Gross Domestic Product. The air filling the balloon causing the surface to expand is our debt.
The more air that is added, the more pressure there is on the surface, increasing the strain on our economy. Increasing the temperature of the air in the balloon increases the pressure even more, and rising interest rates are the flames that turn our debt into a raging inferno.
At first, the surface of the balloon expands easily with a small amount of air and little pressure. But as the balloon gets bigger, it takes an increasingly larger volume of air to get the same amount of surface expansion while building pressure on the surface, risking a rupture. If a rupture occurs, the air escapes and the surface contracts rapidly, resulting in a recession or worse.The economic theory behind debt expansion is that people borrow money to buy things like houses, cars, furniture, appliances, which provide jobs to people who sell them and make them. Companies then borrow money to expand production, build new facilities, and hire more workers. All of this works together to boost the economy.
The problem is, the more debt we have, the more future income must be used to pay the debt and its interest, which reduces the money we have to spend on things. This works to slow the economy.
Eventually, the negative effect of the debt load becomes stronger than the positive effect of the added spending and a recession is triggered -- or worse. In fact, it has been the fiscal policy of the United States to pursue economic expansion by promoting more borrowing for the past 50 years.
The major flaw in this approach is that it takes increasing levels of debt growth to achieve the same level of economic expansion. This can only continue until the burden of maintaining the debt exceeds the increased spending capacity of the borrowed funds. Rising gap between US Debt and GDP
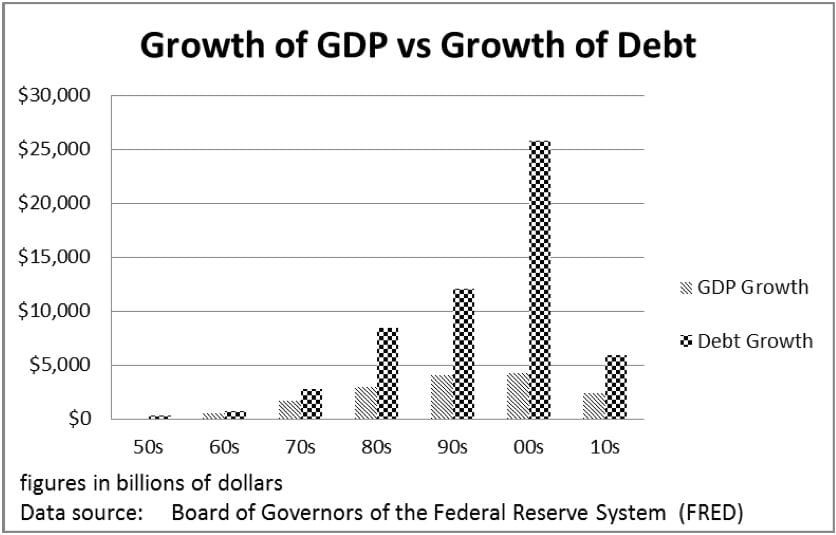
We can see the principle that it takes increased debt to achieve the same GDP growth in real numbers when we compare what has happened in our economy since 1950.
Tracking the growth of debt vs growth of GDP (billions)Decade GDP Debt % of GDP 50s $223 $318 143%60s $512 $727 142% 70s 1,705 $2,787 163%80s $2,897 $8,418 291% 90s $4,013 $12,073 301% 00s $4,197* $25,771* 614%
Year10 $667 $353 0.53% 11 $587 $1,140 194% 12 $601 $1,998 332% 13 $660 $2,009 304%
*Note: In 2007 debt growth hit 769% of GDP growth just before total debt and GDP declined in part of 2008 and 2009, but reached record levels again by 2010.
Consumer debt has already swelled well above pre-recession peak levels
- Pre-recession peak: July 2008, $2.675 trillion.
- Current debt: January 2014, $3.112 trillion.
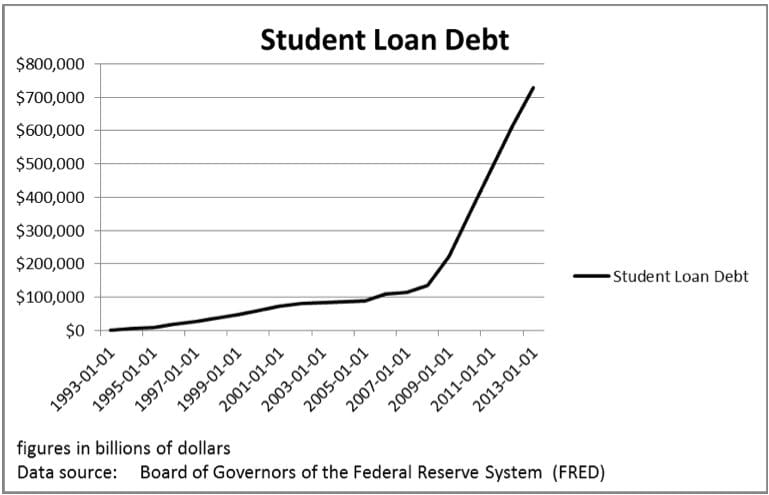
U.S. student debt exceeds $1 trillion as the delinquency rate increases to as high as one third.
Automotive News reports a gradual rise in trade-ins with loans underwater beginning in the third quarter of 2011.
- 2011 Q3: 22.0% trade-ins upside down
- 2012 Q3: 23.6% trade-ins upside down
- 2013 Q3: 25.9% trade-ins upside down
- 2014 Q3: 27.3% trade-ins upside down According to information from the Power Information Network, a combination of low or no down payment required and longer loan terms of 73 to 96 months were the primary drivers. However declining prices in the used-car market also had an impact
It became more difficult to get home equity loans after the 2009 housing crisis, but not difficult enough to stop them. In 2013, $111 billion in new HELOCs were taken out, according to Credit.com.
Are American’s trying to “Live Richly” again? Maybe. Or, many of them could just be trying to hold their ground this time in an economy with stagnant income growth and stealth inflation.
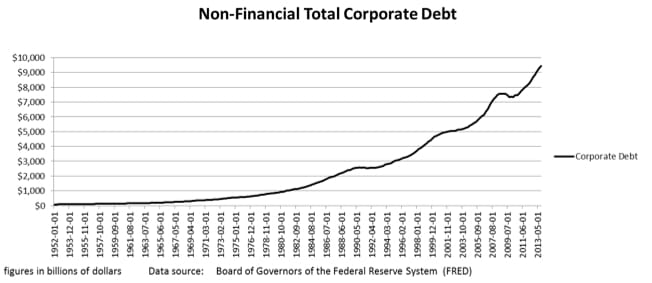
Tech companies like IBM and Apple have led the way in issuing bonds to get money to buy back shares of their own stock, pushing money spent on stock buybacks up 19.5 percent in 2013 to over $475.6 billion.
While the total and annual records have been broken, the record for the largest quarter in stock buybacks is still held by the third quarter of 2007 when $233.2 billion was spent, mostly by troubled banks trying to prop up their stock prices -- a strategy that failed miserably in the end.
Trim Tabs reported in March 2014 that margin debt had reached $452 billion in January and had broken the record-high 7 months running. With previous rapid spikes often preceding significant declines in stock prices, many analysts are wondering if this one is a leading indicator of what is coming if not a direct cause.
I believe the combination of record margin debt, record debt used for corporate stock buybacks, and the amount of personal debt -- like home equity loans -- being used to purchase stock means the amount of debt supporting current stock prices is the largest in history.
The amount of debt supporting stock prices significantly increases the stealth risk in the market. It does not show up in any of the fundamentals or technical charts. It is the risk the people who borrowed that money to buy stocks will have to sell some of their stock to make their debt payments because of financial difficulties occurring elsewhere in their budgets, whether they are investors or companies.
Either the lender will have to write the debt off, which is an expense covered by others borrowing, or the children will get stuck paying the debt, or the taxpayers will end up footing the bill as they did in the 2008 mortgage crisis.
The impact is already being felt. Pretty much every survey and study being conducted indicates that the Boomers are unprepared to end their working days.
Some agencies report as many as a third of the bankruptcies they handle are for clients over 50. And the AARP has found that 34 percent of older Americans are still borrowing on their credit cards just to pay for living expenses like groceries, utilities, and mortgage payments.
As they hit the limit on their credit cards, they must endure the constant harassment of debt collectors, which 50 percent of older Americans already are.
We can predict with 100 percent accuracy that a balloon will burst if we continue to fill it with air. We cannot predict exactly where the rupture in the surface will begin or under how much pressure.
It is not technically feasible to analyze every one of the trillions of molecular bonds on the surface to determine which one is slightly weaker than the others and under what exact pressure the first bond will fail.
The problem with the U.S. economy is exactly the same. It is far too complex to collect all the data necessary fast enough and analyze it in relation to all the other data to determine which segment of the economy is slightly weaker than the others at any given time or under what debt load that segment will fail.
However, we can predict with 100 percent accuracy that as long as we keep pumping debt into the economy, it will eventually collapse. It does not mean the end of the world, but it does mean a big adjustment to life styles.
I am quite certain the end of the current debt-based economic system will not be triggered by a specific GDP-to-debt ratio, or hitting a certain level of foreclosures, or passing a benchmark in credit card defaults.These data points may correlate to a change, but they will not cause it because people on the street do not make their financial decisions based on any of these things. Most people on the street do not know these things exist much less monitor them.
People make their decisions on what to buy, when to buy it, and how much, if any, to borrow to buy it based on their personal situation, advice from people they trust, and a general cultural attitude to some extent.
It is a good bet the government will not lead in trying to fundamentally change directions economically. It has too much vested in the one we have now, both politically and financially, in that it has made so many of the top party supporters on all sides so much money.
Right now, I would put my money on the generation that has been so heavily involved in driving every cultural shift for the last 50 years, my generation, the Baby Boomers. But this time it will not be because they are looking forward. It will be because they are looking back with regrets and leading by bad example.
I don’t know. If all the great economic minds cannot agree on what we can do about it, how should I know? I did not write this article as a set up to sell gold, tell people to buy food insurance, suggest building a survival bunker, take a survival course, or attend a paramilitary training camp to prepare to defend themselves.But there is one thing I am sure of: when the balloon bursts, there will be a mad, desperate witch hunt for somebody holding a pin.
Right in front of the lynch mob, screaming for justice, carrying torches and pitch forks, will be the very people responsible for filling the balloon full of hot air in the first place -- our political leaders. The person, party and/or policy in place at the moment the economy takes a dive will end up taking a dive with it.
What happens with our economy next will be the result of 50 years of intentional fiscal policy by people who knew exactly what they were doing. However, with the way our political system works, these people also knew they would get credit for short-term benefits and not be held responsible for anything bad that happened long term.
Americans in general are financially illiterate and have the attention span of a goldfish. As long as everything holds together until the current elected official or appointed bureaucrat finishes his or her term, he or she will be forgotten in the blink of an eye. As for the people in charge who put us on this path in the 1960s, they are not only forgotten, they are no longer of this Earth.
Photo Credit: Marco Scisetti / shutterstock.com