With two election cycles under its belt, California’s nonpartisan primary system has shown positive results for electoral competition and voter confidence. Studies show that changing the first stage of the election from a private party nomination process to a nonpartisan public process results in more competitive elections, produces a more productive legislature, and enhances overall satisfaction with representation.
California’s Proposition 14, which established a “Top-Two” nonpartisan primary starting in 2012, changed the way primary elections are conducted in the state. Under California’s old traditional system, the primary election served the private purpose of selecting candidates to represent each party on the general election ballot.
Under the new nonpartisan system, all voters can vote for any candidate, regardless of their respective parties. The ‘top two’ vote-getters then proceed to the general election.
This article analyzes approval ratings of government, competitive election data, voter registration levels, and voter participation statistics to better understand the short-term effects that California’s nonpartisan, top-two primary has on voter satisfaction, governance, and electoral competition.
What Effect has the Nonpartisan Top-Two Primary Had on Voter Satisfaction?
As of January 2015, Californians’ approval rating of government, among registered voters, stands at 44 percent. This is four times higher than congressional approval ratings. This percentage is up from a record-low average of 14 percent in 2010. The same data shows that individual approval ratings of their state legislators was at an all-time low of 27 percent in 2010; yet in 2015, this approval rating stands at 53 percent.

Top-Two Increased Competition among Candidates
This upward trend in approval ratings for the California legislature might be a result of candidates having to compete for a broader range of voters. Under a traditional partisan primary system, competition is most often limited to primary election contests. Therefore, candidates faced with a ‘competitive’ primary election were incentivized to compete for the most votes among the majority party members in a given district.
The Lucy Burns Institute, for example, compiled data of all state legislative elections from 2008 to 2014 in the United States. According to their study, California had the most competitive elections in the country for the 2012-2014 cycle. This comes just four years after California was among the states that had the least competitive general elections in the country. Today, 50 percent of California’s races are now competitive.
During the same period, competition in congressional House races has stagnated, with an overwhelming majority of races not competitive in the general election. Cook Political reports that 86 percent of congressional races are not competitive at all, and another 10 percent of legislative seats are generally ‘decided’ by the majority party’s primary. This leaves just 4 percent, or 18 competitive seats out of a total of 435.
Under nonpartisan, top-two primaries, competition may occur in both the primary and the general election stage. In districts where one party is heavily favored, for example, competition rarely, if ever, occurred during the general election. As a result, candidates in a heavily Democratic district were never incentivized to reach out to non-Democratic Party voters in those districts, and visa versa in Republican districts.
Several notable races illustrate the competition for non-major party voters that occurred because of the nonpartisan, top-two primary. There were 29 same-party races in 2012 (19 in Assembly, 2 in Senate, and 8 in House). Seven of these same-party races saw the second-place candidate in the primary win the general election -- something that was impossible before the top-two primary.
Independent Redistricting's Role In Competitive Elections
Critics of top-two argue that even if competition has increased, other factors have played an important role in increasing competition. In 2008, for example, California established an independent redistricting commission, which could also be a factor in California’s increased competition and functioning legislature. The first races held with ‘independently-drawn’ districts were in 2012.
For comparison, the Arizona State Legislature implemented independent redistricting reform in 2000, but they still have traditional open partisan primaries. If independent redistricting is the only causal variable that increases voter satisfaction and competition, we would expect the same increase in approval ratings of the Arizona legislature.
However, after ten years of an independent redistricting commission, 66 percent of Arizona citizens are still dissatisfied with their government, 74 percent believe there is too much partisan conflict in the Arizona State Capitol, and 62 percent are generally unsatisfied with the way things are going in their state government.
Is the California State Legislature Less Partisan under Top-Two?
From 2011 to 2012, before top-two was implemented, legislators voted almost exclusively along party lines. Open Primaries reports that Democrats voted the party line 99 percent of the time while Republicans voted the party line 94 percent of the time.
Since then, coalitions of Democratic and Republican legislators have been more willing to buck the party line. As a result, several notable cross-party efforts have led to the modification, passage, or blockage of significant legislation.
Confidence in government should not be disassociated with the tendency of legislators to vote, or not vote, along party lines. Nationally, for example, 94 percent of all voters now think that the polarization of the United States Congress is a problem and 65 percent of all voters consider partisan gridlock a major problem. This comes at a time when the average vote-along-party-lines in the 114th Congress for House Democrats is 93.2%, House Republicans 93.6%, Senate Democrats 95%, and Senate Republicans 86.8%.
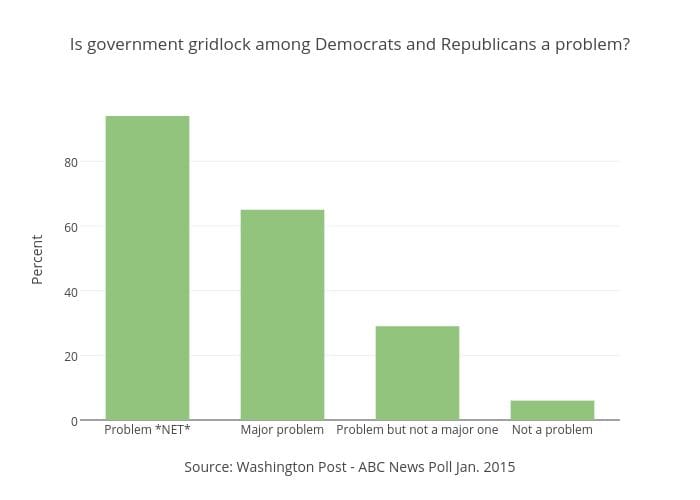
Chart via Plotly
The Percentage of Voters Registered with “No Party Preference” is Rising Faster under Top-Two Primary
Since 1999, nonpartisan voters have seen the most significant increase in registrants compared to all other political parties in California. From 1999 to 2014, those registering as No Party Preference (NPP) skyrocketed compared to those registering as Democrats and Republicans. There was a 118 percent growth in NPP voters compared to a 10 percent increase in Democratic voters and a decrease of 5.3 percent in those registered as Republicans.

Today, in California among registered voters, No Party Preference voters make up 23.6 percent, 28 percent are registered Republican, and 43 percent are registered Democrats. Despite fluctuations in registration levels for Democrats and Republicans, the overall trend suggests that more Californians choose to register as nonpartisans.
In the graph below, the fluctuation in registration levels among Democrats and Republicans is due to the election cycle. Voter registration data shows that registration among Democrats and Republicans spike in presidential election cycles (2004, 2008, and 2012) and then declines in off years.
Conversely, registration among nonpartisan voters steadily increased during the same period, with a more significant spike in registration since the 2012 presidential primary -- up a staggering 115% in just 4 years.

It is important to note that, although California has nonpartisan elections for all statewide offices, the presidential primary is still conducted under the old semi-closed system. This could explain the more rapid decline of Republican registrations in off years compared to Democratic voters. Whether this has had an effect on actually increasing the popularity of the Democratic Party relative to the Republican Party in California will be left to another analysis.Critics of nonpartisan open primaries argue that the tendency of voters to vote for either Republicans or Democrats proves that voters are really ‘closet’ Democrats or Republicans. However, this data highlights the opposite. In short, voters often ‘join’ political parties because they are forced to join as a condition of participating in the presidential primary.
Most simply, both political parties benefit from laws that force voters to associate with their private organization in order to participate at the primary stage of the election. Therefore, registration within the two major political parties is not a solid indicator of the number of voters who are actually satisfied with being represented by either party.
As in all presidential election cycles, the political parties are likely to see a major increase in party affiliation during the 2016 presidential election. That increase will not be due to more voters supporting the Republican or Democratic Party, but rather due to the fact that they have to join (or at least participate in a partisan election of) one of the two major political parties to vote for a favored candidate, whom they also think will be a viable candidate in the general election.
In a presidential election, the only outlet for a voter to cast a meaningful vote, regardless of the voter’s party preference or affiliation, is to vote in the Democratic or a Republican primary. Some proactive nonpartisan voters will de-register with a major party after the presidential election, but the majority will remain under one of the two major parties ‘in name only.’
This helps explain why party registration increases each presidential year, while primary election participation slowly drops in between.
The dramatic spike in California nonpartisan voter registration, since the last presidential election, suggests that voters are more likely to register and vote when they don’t have to join a political party to do so.
Based on this data, it is reasonable to conclude that registration numbers for Democrats and Republicans are artificially inflated because of partisan election laws. Nationwide, where 47% of states hold partisan-based elections, 45% of voters now self-identify as independent (aka “No Party Preference”) voters. Yet, the number of voters who register as independent is dramatically lower.

Top-Two Is Not the Cause of Decreased Voter Turnout
The effect of top-two on voter turnout is minimal. However, voter turnout statistics among nonpartisans versus party-affiliated voters provide insight into the short-term effects of California’s nonpartisan top-two system. It is important to keep in mind that voter turnout in primary elections nationwide is plummeting especially in states with closed primaries. In New Jersey, for example, the turnout in 2014 was just 8 percent. In 2015, it was just over 5 percent. Nationwide, the average turnout in primary elections is just over 10 percent.

Even though California’s turnout in primary elections is low at about 25%, it remains high compared to other states, always in the top ten since 1980. Critics of top-two argue that California’s voter turnout is the lowest it has ever been as a result of the election model. While it is true that voter turnout declined in California, it seems unlikely that top-two has discouraged turnout, and is more likely a consequence of voter apathy on a national scale.

When national voter turnout trends are considered, California has actually outperformed average voter turnout. More importantly, it appears that nonpartisan voter turnout has actually increased in California. This has kept California’s numbers, in total, higher than the national average.
Turnout among Nonpartisan Voters is Outperforming Partisan Voters in California
Although California hosted its first nonpartisan primary in 2012, the 2010 primary election is a logical starting point for analyzing the effect of the nonpartisan, top-two primary on voter turnout. Participation by No Party Preference voters in 2010 increased 23 percent, compared to a 14 percent increase for party-affiliated voters.
The apparent anomaly can be explained by one important consideration: California’s nonpartisan primary proposition (“Proposition 14”) was on the primary election ballot in 2010. During the same year, the Independent Voter Project conducted a statewide voter education campaign directed at nonpartisan voters with a simple message: “Proposition 14 will allow any voter to vote for any candidate, regardless of party affiliation, in the primary election.”
Prior to Proposition 14, nonpartisan voters could only vote in the Democratic primary for Democratic candidates or limit their participation to state initiatives and local nonpartisan elections.
The higher turnout in 2010 suggests that nonpartisan voters will turn out in higher numbers when they are given an opportunity to make their vote more meaningful.
Opponents of top-two have pointed to the decrease in 2012 primary election turnout as evidence of its failure. However, lower turnout rates can also be explained by the fact that although the June primary was a presidential primary, the major party nominations were not competitive in California. Barack Obama was not seriously challenged on the Democratic ticket and Mitt Romney had already locked up the nomination for the Republicans. Because the presidential nominations were already decided, media attention and voter turnout efforts were low for a presidential year.
Further, of consideration is the fact that turnout among nonpartisan voters alone actually increased in 2012 and decreased at a much lower rate than partisan voters in 2014.

*Note: 2008 was not included because the 2008 election featured a separate June primary for all contests except the nomination for president.
Considered together, declining voter turnout is most likely attributable to general voter apathy in election processes that are conducted for the partisan benefit of the Democrats and Republicans. At the same time voters are increasingly disillusioned, on a national scale, with the ability of those two parties to adequately represent them.

Conclusions and Incentives for Future Democratic Reforms
When voters are given a reason to vote, unconditioned by having to join a party, they do.
In the primary election of 2012, according to voter participation statistics by Political Data Inc., No Party Preference voters saw another increase in participation (4.6 percent), which outperformed Democratic voter participation (2.3 percent) and Republicans (-6.5 percent). Even though all political parties show a decline in primary participation in 2012 and 2014, nonpartisan turnout actually increased in 2012 and decreased far less than partisan voter turnout in 2014.
Over time, nonpartisan open primaries could prove to be a powerful remedy for declining voter turnout. Also, the nonpartisan, top-two primary reform might end up counter-balancing the loss of primary participation due to citizen initiatives moving to the general election ballot.
While the full effect of nonpartisan primaries will take several years, the short-term data from voter participation rates by party suggest that voters are more likely to register as nonpartisans and much more likely to participate when they are not forced to join a political party.
Critics argue that despite nonpartisan elections being enacted, California witnessed a decline in participation rates. This data ignores the reality. Participation by partisan voters has dropped much faster than nonpartisan voters in California. And participation by all voters is dropping nationwide.
As voters increasingly express their dissatisfaction of the polarization within the political system, the election laws should catch up to the national trend. Counterintuitive to the purpose of nonpartisan elections is that Republicans and Democrats elected under nonpartisan systems end up with much higher approval ratings (See Californians’ satisfaction rate with their government above).
This anomaly can be explained, most simply, by considering incentives. When representatives are incentivized to appeal to a narrow partisan base by virtue of closed primary systems - only that narrow partisan base is truly represented. In a nonpartisan system, every voter’s vote carries equal weight.
Editor's Note: Caitlin Hurkes is a research fellow with the Independent Voter Project, the author of California’s nonpartisan, top-two open primary and a national leader in nonpartisan election reform.
Photo Credit: Andrew Zarivny / Shutterstock.com