Campaigns Likely To Use Census Figures To Gain Advantage


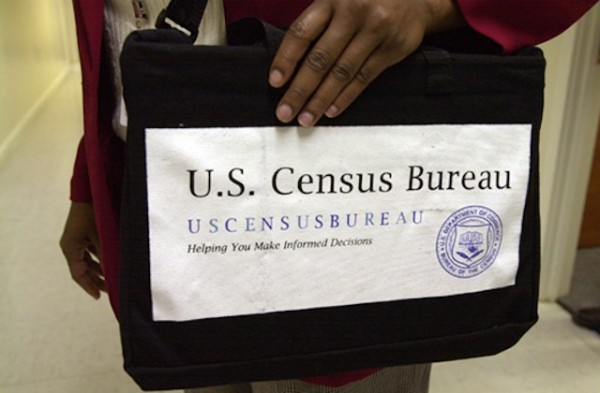
The U.S. Census Bureau released its report on income, poverty, and health for 2011 this past week. The information in it will likely have an impact on how candidates on the campaign trail focus their message on the economy, job creation, and healthcare as we get closer to November.
The poverty rate in America is statistically flat from the previous year. The nation’s official poverty rate in 2011 was about fifteen percent, which means roughly 46.2 million people are at or below the poverty line in the United States. After three consecutive years of the poverty rate rising, it finally leveled off from 2010 to 2011.
One question that is being frequently debated during the current election season is, are we better off now than we were four years ago? There are several factors to consider when measuring progress and productivity in the economy. So, the bigger question is, is the matter as simple as some would have you believe?
The campaign strategy for Republican and conservative leaders is to ask the four year question because they will take 2008 figures solely at face value without bothering with the details. This tactic isn’t exclusive to the GOP, but is common on the campaign trail when a politician wants to use misappropriated data to back up a talking point.
It is an act of intellectual dishonesty to take only a small piece of a much larger picture and promote it as truth. For instance, people who are primarily focused on getting President Barack Obama out of office will take the unemployment rate in September 2008 and compare it to the unemployment rate now.
At face value, the unemployment figure is obviously higher. There are so many variables that go into calculating the unemployment rate it is easier to just take the number as it is only when it suits the argument being presented. Unemployment is currently at 8.3 percent, which is higher than the 6.1 percent it was at four years ago. This is not considering that unemployment was on the rise in 2008 and we were seeing consecutive months of net job loss as opposed to consecutive months of net job gains as we have seen recently.
Now, a number that could damage the president’s public perception to some degree is the figures for median house income and healthcare. The report from the Census Bureau reveals that real median household income fell 1.5 percent from 2010 and was at $50,054 in 2011. The number of people on health insurance also fell from fifty-million to 48.6 million. Regardless of how much control the President of the United States has over this number alone, people will still say it happened on President Obama’s watch.
The incumbent is currently ahead of GOP presidential nominee Mitt Romney in nationwide polls and has promised to help the middle class while accusing his opponent of only looking after the wealthiest Americans. Mitt Romney has struggled to show that he can relate to middle income earners, which is evident in how he defines ‘middle income.’
On Friday, Romney was interviewed on ABC’s Good Morning America. He was asked if he would define ‘middle income’ as $100,000. Romney replied:
“No, middle income is $200,000 to $250,000 and less,”
People will perceive this as the GOP nominee being out of touch with a middle class that is struggling in the worst economic recovery since the years following the Great Depression. The Romney campaign attempted to clarify that he meant household income, and not individual income.
Even if Mitt Romney meant family household median income, the figures he quoted are still dramatically higher than the findings of the Census Bureau. The median income for families dropped to $62,273 in 2011, which is a decline of 1.7 percent from the previous year. Romney’s remarks Friday morning won’t help his perception with middle class voters, but the fact that median income has declined could just as easily hurt the Obama campaign to some degree as well.
Are we better off today than we were four years ago? It is not so simple that we can just say, ‘yes’ or ‘no.’ In many areas it can, indeed, be said we are better off, but then there are some areas that have seen little to no improvement at all. It might be more appropriate to ask, are we better off now than we were three years ago? Late 2009 is when we started to see some measure of recovery from a recession we were still in the midst of in 2008.
Since the economy is the number one concern among voters, especially independent voters, people will focus on what they perceive as improvements and what they perceive as failures. Campaigns will use the figures from the U.S. Census Bureau and data from other sources to convince you one way or the other. When examining the information presented, it is important to take every factor into consideration.


