America's Healthcare Expenditure - Where Does $3.3 Trillion Go?

Getting an accurate count of how much Americans spend on healthcare every year and the specific items they purchase, like prescription drugs, is tricky.
Think about it like this. If you are a small business owner or anyone else who itemizes their expenses, you have tough calls to make.
For example, I use the mobile app Mint to track and sort my expenses. If I purchase internet access on a plane, does it go under “Business Services” or “Travel?” If I buy a bottle of wine for a business acquaintance, does it go under “Alcohol and Bars” or “Gifts?”
Imagine doing this type of thing for all $3.3 trillion Americans spent on healthcare in 2016.
Three point three trillion dollars is the most commonly used estimate of healthcare spending in 2016. The National Health Expenditure Accounts are published annually by the Centers for Medicare & Medicaid Services (CMS), a division of the U.S. Department of Health and Human Services.
While I find it difficult to fully trust an organization which can’t even abbreviate its own name correctly, most people do trust CMS.
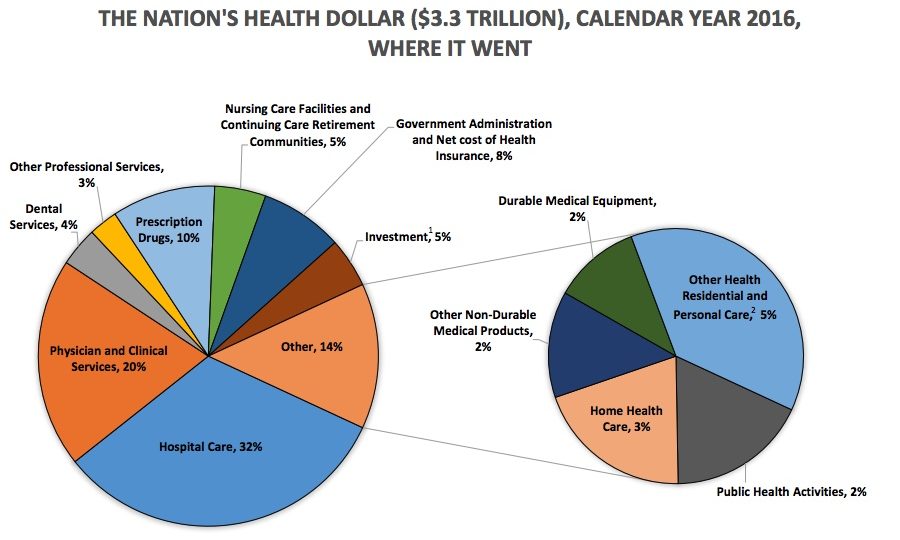
The summary of America's healthcare expenditure is called the National Health Expenditure (NHE). CMS publishes a chart showing the percentage of the $3.3 trillion that goes to hospital care (32%), dental services (4%), home health care (3%), prescription drugs (10%), physician and clinical services (20%) and several other categories.
Centers for Medicare & Medicaid Services 2016 National Healthcare Expenditure

CMS also publishes a seemingly unlimited number of spreadsheets to support their aggregate charts. I downloaded a zip file containing a spreadsheet that claimed to have historical data for healthcare spending since 1960.
With 544 lines and 58 rows of data, this claim seemed well-founded at first. Turns out not all categories are available for every year, but 2003 through 2016 is complete, and a fifteen year history is probably most helpful in examining the rate of change in healthcare spending. Hospital prices in 1960 is trivia. Hospital prices over the last 15 years are data.
Many other estimates of America's healthcare expenditure are derivative of the CMS number, and show different results of types of spending depending on how they are calculated.
Some are not based on the CMS findings. America’s Health Insurance Plans (AHIP), the insurance industry’s lobbying association, has an estimate that is largely based on commercial databases.
AHIP - Where Does Your Health Care Dollar Go?
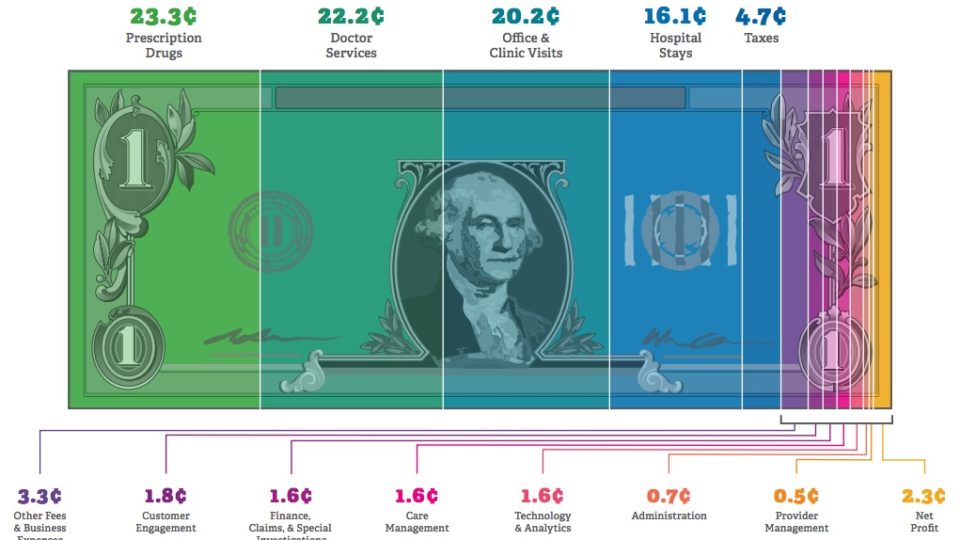
Note some of the differences between the AHIP study and the CMS NHE report. Drug expenditures, according to AHIP, are 130% more than the government estimate. Hospital expenditures are half of the CMS report estimate. Physician and Clinical Services is 20% according the CMS. AHIP makes Doctor Services and Clinic Visits separate categories, and the two combine for 42.2% of the health spend.
Interestingly, AHIP claims health insurers get about 12 cents of America’s healthcare dollar, while CMS gives insurers about 7% of the 2016 healthcare spend.
Why the extreme variances?
From a political perspective, it is worth thinking about AHIP’s role as an advocate for health insurance companies, and who they compete with in the public policy arena when comparing the CMS numbers to AHIP’s estimate. (SPOILER - health insurance companies are in constant legislative combat with doctors and drug manufacturers) Nobody wants to be seen by policy makers as taking too much of the pie, or having their prices rise at too fast a rate.
From a methodological perspective (which may also be political), AHIP’s choices are odd. They surveyed 5 for-profit insurance companies and 25 not-for-profit insurance companies. Out of the top ten health insurers, accounting for 207,010,000 people, or 71% of the 292 million with health insurance in America, three are non-profit. Those three non-profits account for 31,000,000 insurance subscribers, or 15% of the top ten.
AHIP’s methodology shows how they chose the 5 for-profit insurers and 25 not-for-profit insurers, but not why. Their sample uses about 17% for-profit companies, when more than 75% of Americans are insured by for-profit companies.
Similarly, AHIP uses only claims by patients under the age of 65. Also very odd since we know that the majority of healthcare spending comes at the end of life.
I found this with an hour’s worth of Google searching. AHIP knows this. Their sampling is skewed to produce an outcome. Why would health insurers do this?
Likely because the CMS numbers show that over the last 15 years, the cost of health insurance has been one of the fastest growing costs in healthcare. Faster than pharmaceutical manufacturers and faster than physician services. The cost of Big Insurance is rising faster than their traditional legislative sparring partners, pharma and the docs. They don't want the attention.
National Healthcare Expenditure Price Increases by Category ‘03 through ‘16
Expenditure Category
Mean Annual Percent Increase
Difference From NHE Mean
Total National Health Expenditure (NHE)
5.00%
0.00
Hospital Care
5.51%
0.51
Physician and Clinical Services
4.65%
-0.35
Other Professional Services
5.24%
0.24
Dental Services
3.81%
-1.19
Other Health, Residential, and Personal Care
5.71%
0.71
Home Health Care
6.27%
1.27
Nursing Home & Retirement Facilities
3.68%
-1.32
Prescription Drugs
5.20%
0.20
Other Non-Durable Medical Products
4.02%
-0.98
Durable Medical Equipment
4.27%
-0.73
Government Administration
4.75%
-0.25
Net Cost of Health Insurance
6.24%
1.24
Government Public Health Activities
3.39%
-1.61
Research
2.91%
-2.09
Structures and Equipment
3.70%
-1.30
An IVN extrapolation based on CMS findings.
Another analysis of the pharmaceutical drug manufacturers receipts from the NHE comes from the Berkeley Research Group (BRG). Funded by the Pharmaceutical Research and Manufacturers Association (PhRMA), the drug manufacturer's lobby, the BRG study shows that prescription drug spending accounts for 14% of the NHE, compared the the CMS 10%.
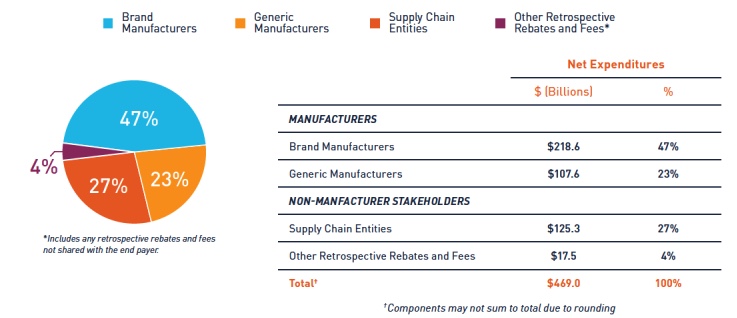
While the BRG research shows a larger pharmaceutical piece of the healthcare pie, it also shows that the share actually going to pharmaceutical manufacturers is shrinking. The BRG study shows that brand manufacturers realize about 47% of the money spent on pharmaceutical drugs.
Berkeley Research Group
SHARE OF 2015 NET DRUG EXPENDITURES REALIZED BY MANUFACTURER AND NON-MANUFACTURER STAKEHOLDERS
So we have a government study and two competing studies from industry associations displaying conflicting information. This is probably the time for me to share a battle-worn test I learned from more than a decade in DC. How do you know if a lobbyist is lying? Her lips are moving.
That being said, if the Berkeley Research Group is lying, they are doing a much better job of it than AHIP. While the AHIP study methodology has several points, noted above, that stick out as odd at first glance, the PhRMA study passes the smell test.
The non-manufacturer stakeholders referenced in the chart above have been coming under a lot of scrutiny. That $142.8 million (and maybe more) largely goes to pharmacy benefit managers (PBMs). PBMs are little-known entities that have come to virtually control retail pricing of prescription drugs. And that is all they do. They don't try to make pharmaceutical drugs better, they don't ship prescription drugs, they don't sell prescription drugs to consumers, they simply set the prices. And the top three players in the industry, all Fortune 25 companies, make about $300 billion annually doing so. The PBMs are subsidiaries of a retail pharmacy, CVS, a pharmacy by mail, Express Scripts and the nation's largest insurance company UnitedHealth.
So how much of America's health care spend does Big Pharma realize? Depends on who you ask. Either 10% (CMS), 14% (PhRMA) or 23.3% (AHIP). And you can probably find more estimates. In fact, the links in this article all have the tools you need to research further and make your own decision. If you have a different analysis, send it my way. We'll likely publish it.
Latest articles