Taxpayers Continue to Flee States with Heaviest Tax Burdens

United Van Lines (UVL) is one of the largest moving companies in the United States. Each year since 1977, UVL has issued a study of interstate migration patterns. This study reports the share of outbound shipments in total interstate shipments for UVL for each of the 48 “Lower United States” (e.g. all states but Alaska and Hawaii). We include this data in State Data Lab, along with a wide variety of other economic, demographic, and government financial data.
On January 2 2014, UVL publicly released the results of its latest (2013) migration study. The results were generally in line with those in 2012, and states with greater fiscal challenges continue to experience greater out-migration.
Here’s a list of the eight states for which UVL reported the highest share of inbound shipments in total shipments (e.g. higher net in-migration):
- Oregon
- South Carolina
- North Carolina
- South Dakota
- Nevada
- Texas
- Colorado
- Florida
At the other end of the spectrum, here are the ten states with the highest share of outbound shipments (e.g. greater net out-migration) in total UVL shipments in 2013:
- New Jersey
- Illinois
- New York
- West Virginia
- Connecticut
- Utah
- Kentucky
- Massachusetts
- New Mexico
- Mississippi
Most of the state governments for these top 10 ‘exit’ states are facing significantly greater fiscal challenges than other states. The chart below shows the average Truth in Accounting estimate for “Taxpayer Burden” (a measure of state debt loads in light of assets available to pay bills). Three categories are shown: the 8 states with high in-migration, the 10 states with high out-migration, and the other 30 continental states. States in the ‘top 10’ for out-migration clearly have the worst fiscal challenges.
Credit: Truth in Accounting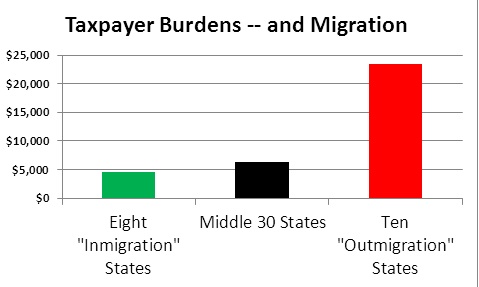
Recent out-migration patterns have weighed on the financial performance of the fiscally challenged states, mainly through the implications for tax revenue. However, the TIA “Taxpayer Burden” estimate is a product of long-running fiscal practices, not just recent migration trends. In especially fiscally-challenged states, the factors driving poor long-run fiscal outcomes have also been making moves into the state less attractive, while prompting some residents (and their income) to seek out higher / drier ground.
In November 2013, the American Legislative Exchange Council (ALEC) issued their annual “State Tax Cut Round Up.” This survey looks across a broad range of tax categories and also produces a bottom-line estimate for the number of states that “cut taxes.” ALEC determined that 18 states effectively “cut taxes” in 2013.When ranking the lower 48 states on the TIA “Taxpayer Burden” estimate, none of the 10 states with the highest Taxpayer Burdens “cut taxes” in 2013. And, the average “outbound shipments %” for these fiscally challenged states came to 56% in 2013, well above the 48-state average.
Fiscally challenged states are challenged in part because some voters are voting with their feet. By choice or necessity, these states have also been less likely to respond with favorable tax changes.

Latest articles