Does Money Buy Happiness?

Rule number one in effective communication is to establish the relevancy of the topic to the audience. Why should they care? How does it affect their quality of life?
Truthful accounting might do just that.
For one measure of the states’ quality of life, we turn to the recent work done by Ballotpedia, a “collaborative encyclopedia designed to connect people to politics.” The site focuses on providing a comprehensive and non-partisan analysis of numerous candidates and political efforts. The Lucy Burns Institute launched its Ballotpedia initiative in 2009 in order to provide a comprehensive guide to state politics.
Ballotpedia recently published Part 2 of its “Who Runs The States” report, which introduced its “State Quality of Life Index” (SQLI). The SQLI ranks states based on 19 indicators of economic, health, business and government conditions. The result is a single one-to-fifty ranking of which states have the best and worst quality of life.
Ballotpedia has compiled data for these indicators for all 50 states, with many series going back 20 years. As Greek philosopher Heraclitus once stated, “The only constant is change.” This breadth of data allows us to look at which states have become relatively more attractive place to live over the past two decades.
It turns out that the states have experienced a fair amount of change over the past twenty years. Nine states displayed double-digit increases in their SQLI ranking over the time period while eight states saw their rank tumble by more than ten positions. (The nine rising states were Tennessee, Virginia, Maryland, Georgia, Utah, Idaho, North Dakota, North Carolina, and Texas. The eight states with double-digit declines in their SQLI ranking were Michigan, Delaware, New Jersey, California, Hawaii, Illinois, Connecticut, and Nevada.)
Certainly, no single factor can explain these developments, but could state government finances be related to the changes in the quality of life? The answer is apparently “Yes.”
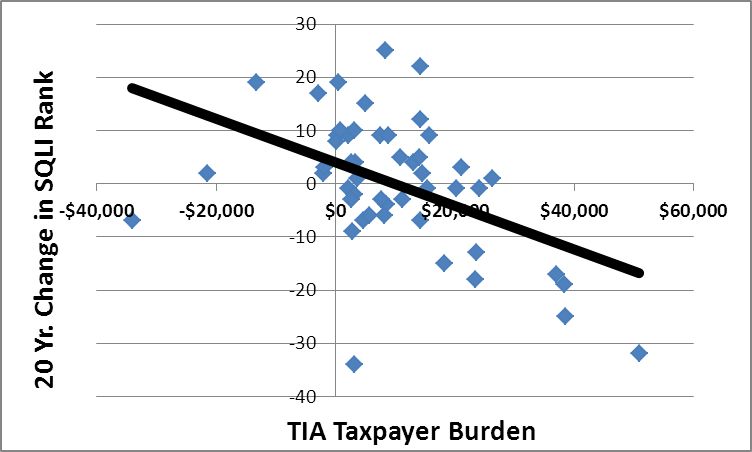
The chart above shows the change in Ballotpedia’s SQLI (State Quality of Life) index over the past 20 years (on the left or “y-axis”), relating it to Truth in Accounting’s “Taxpayer Burden” measure (on the bottom or “x-axis”). States with lower current debt loads tend to show improvement in their SQLI, while states with higher current debt loads tend to show deterioration in their SQLI.

The average current TIA Taxpayer Burden for the eight states with double-digit declines comes to roughly $29,000. This is nearly ten times as high as the average Taxpayer Burden of $3,300 for the nine states with double-digit increases in their SQLI ranking.
Who’s driving the bus? Why are some states better places to live? Why are long-term changes in this measure of ‘quality of life’ linked to state fiscal conditions? And does poor fiscal health directly impact the components of the quality of life index, or are both driven by a common cause?
While these answers might be difficult to pin down, the whole issue illuminates an important truth: the government’s decisions affect the quality of our lives.
That should be relevant to every citizen.
Want to see how your state stacks up, on these and other metrics? Check out State Data Lab.
Latest articles


